. 2010 May 4;107(18):8287-91.
doi: 10.1073/pnas.0913744107. Epub 2010 Apr 20.

Role of macroscopic particles in deep-sea oxygen consumption

Affiliations

Role of macroscopic particles in deep-sea oxygen consumption

Alexander B Bochdansky et al. Proc Natl Acad Sci U S A. .

Abstract

Macroscopic particles (>500 mum), including marine snow, large migrating zooplankton, and their fast-sinking fecal pellets, represent primary vehicles of organic carbon flux from the surface to the deep sea. In contrast, freely suspended microscopic particles such as bacteria and protists do not sink, and they contribute the largest portion of metabolism in the upper ocean. In bathy- and abyssopelagic layers of the ocean (2,000-6,000 m), however, microscopic particles may not dominate oxygen consumption. In a section across the tropical Atlantic, we show that macroscopic particle peaks occurred frequently in the deep sea, whereas microscopic particles were barely detectable. In 10 of 17 deep-sea profiles (>2,000 m depth), macroscopic particle abundances were more strongly cross-correlated with oxygen deficits than microscopic particles, suggesting that biomass bound to large particles dominates overall deep-sea metabolism.


Conflict of interest statement

The authors declare no conflict of interest.

Figures

Fig. 1.
Fig. 1.
As determined by video profiles, the relative number of particles (>500 μm) per frame, and the estimated particle number per liter (in brackets), in 100-m bins in a section across the equatorial Atlantic. White bars show the bottom depths (where bars are absent, depth exceeded 6,000 m). The euphotic zone was excluded from analysis (gaps in the top of the individual profiles), because daylight interfered with the contrast of the video images. RFZ indicates the extent of the Romanche Fracture Zone in the mid-Atlantic Ridge.
Fig. 2.
Fig. 2.
Example of a deep-sea profile of sigma-t, oxygen (μmol/kg), relative particle numbers per frame from video observations (video; 100-m moving average), and optical backscatter (obs; 100-m moving average). Optical backscatter decreases with depth and remains low. In contrast, defined particle peaks in the macroscopic particle profile were present in the deep sea. Watermasses: SACW, South Atlantic Central Water; AAIW, Antarctic Intermediate Water; uNADW, upper North Atlantic Deep Water; mNADW, middle North Atlantic Deep Water; lNADW, lower North Atlantic Deep Water; AABW, Antarctic Bottom Water. The upper mixed layer is not shown.
Fig. 3.
Fig. 3.
Cross-correlation coefficients (rXCF) of oxygen concentration versus macroscopic particles (>500 μm; video), and oxygen concentration and optical backscatter (obs). (AD) Upper 2,000 m of the water column. (EG) Deep sea >2,000 m. (B, D, F, and H) Means of cross-correlations of all stations with standard deviations (bars). Asterisks are negative cross-correlations between oxygen and macroscopic particles that exceeded those between oxygen and optical backscatter. All cross-correlation coefficients were significant at α = 0.05 as determined by randomizations, except those marked with ns. Triangles indicate two instances in which the presence of a deep nepheloid layer may have influenced the outcome of the cross-correlation analysis.
Fig. 4.
Fig. 4.
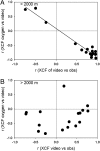
Cross-correlation coefficients (rXCF) for oxygen against macroscopic particle numbers (y axis) and cross-correlations between microscopic and macroscopic particles (x axis). (A) In the upper 2,000 m, microscopic and macroscopic particle peaks were strongly colocated in the water column (large positive rXCF; x axis) with three exceptions where they were out of phase (upper left quadrant). (B) Below 2,000 m, microscopic and macroscopic particle peaks were more frequently decoupled, resulting in some negative values on the x axis (lower left quadrant). In these six cases, oxygen values were strongly and negatively cross-correlated with macroscopic particle peaks and not with microscopic particles.

Similar articles

Cited by

References

    1. Turner J. Zooplankton fecal pellets, marine snow and sinking phytoplankton blooms. Aquat Microb Ecol. 2002;27:57–102.
    1. Fowler SW, Knauer GA. Role of large particles in the transport of elements and organic compounds through the oceanic water column. Prog Oceanogr. 1986;16:147–194.
    1. Michaels AF, Silver MW. Primary production, sinking fluxes and the microbial food web. Deep Sea Res. 1988;35:473–490.
    1. Suzuki N, Kato K. Studies on suspended materials. Marine snow in the sea I. Sources of marine snow. Bull Faculty of Fisheries, Hokkaido Univ. 1953;4:132–137.
    1. Alldredge AL, Silver MW. Characteristics, dynamics and significance of marine snow. Prog Oceanogr. 1988;20:41–82.

Publication types