. 2010 Apr;22(4):1264-80.
doi: 10.1105/tpc.109.073635. Epub 2010 Apr 20.

Functional modules in the Arabidopsis core cell cycle binary protein-protein interaction network

Affiliations

Functional modules in the Arabidopsis core cell cycle binary protein-protein interaction network

Joanna Boruc et al. Plant Cell. 2010 Apr.

Abstract

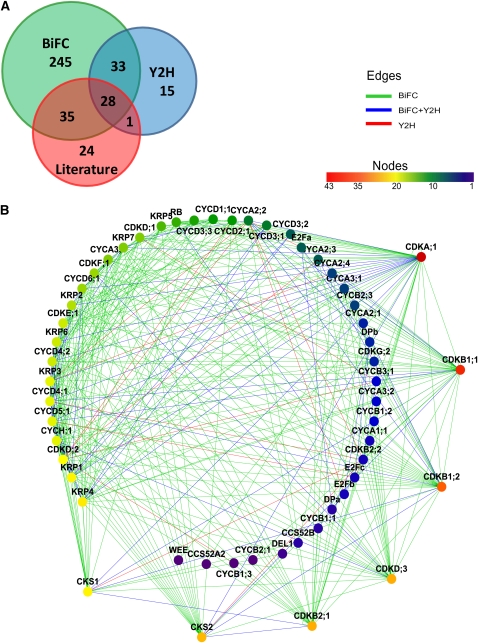
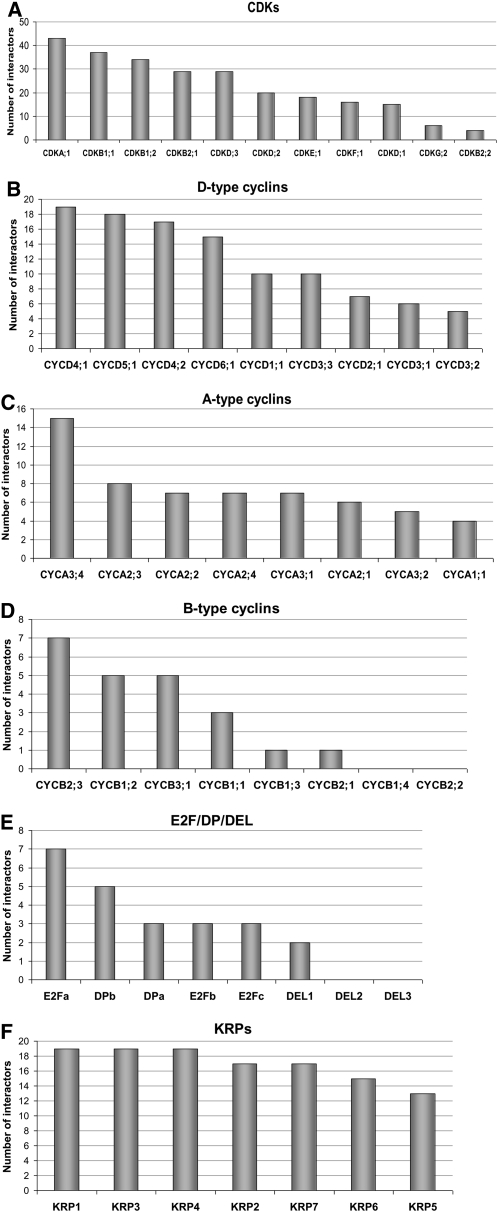
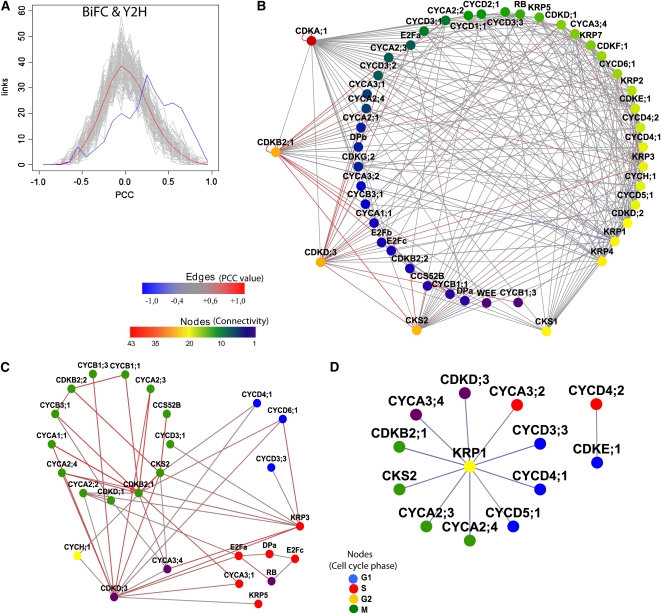
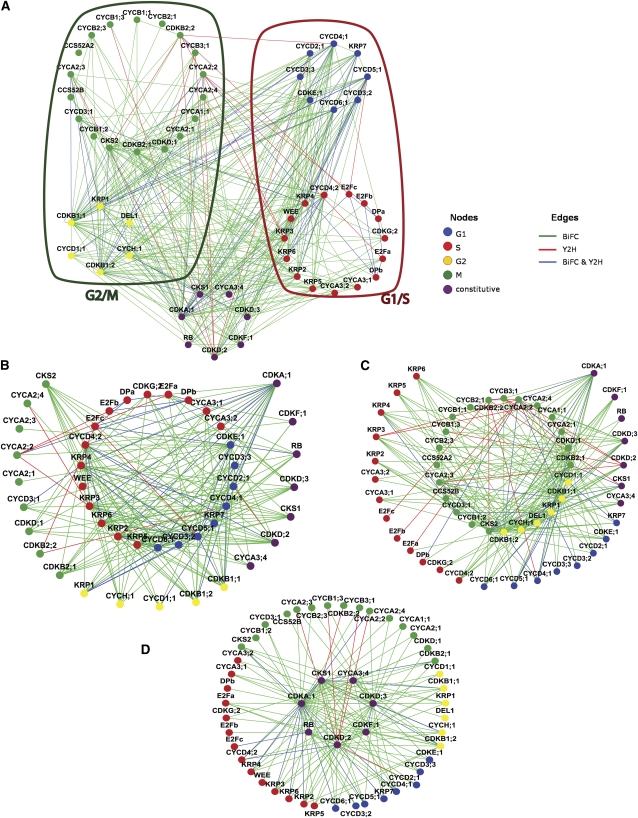
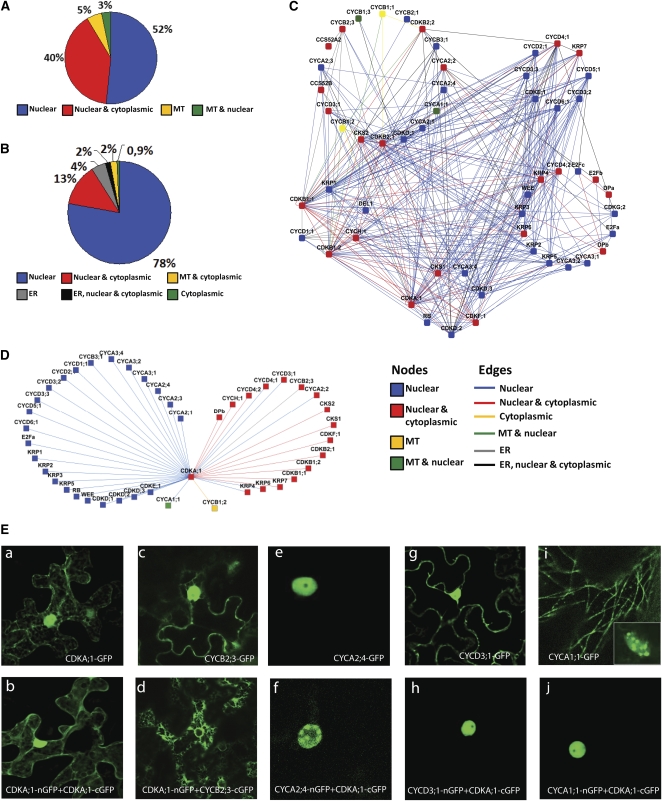
As in other eukaryotes, cell division in plants is highly conserved and regulated by cyclin-dependent kinases (CDKs) that are themselves predominantly regulated at the posttranscriptional level by their association with proteins such as cyclins. Although over the last years the knowledge of the plant cell cycle has considerably increased, little is known on the assembly and regulation of the different CDK complexes. To map protein-protein interactions between core cell cycle proteins of Arabidopsis thaliana, a binary protein-protein interactome network was generated using two complementary high-throughput interaction assays, yeast two-hybrid and bimolecular fluorescence complementation. Pairwise interactions among 58 core cell cycle proteins were tested, resulting in 357 interactions, of which 293 have not been reported before. Integration of the binary interaction results with cell cycle phase-dependent expression information and localization data allowed the construction of a dynamic interaction network. The obtained interaction map constitutes a framework for further in-depth analysis of the cell cycle machinery.


Figures

Figure 1.
Figure 1.
The Core Cell Cycle Binary PPI Screen. (A) Comparison of the BiFC and the Y2H results and overlap between interactions detected in the two binary screens and the literature-based data. (B) Graphical representation of the network. Node color represents the connectivity of each protein. A rainbow scale is used, with red as the most connected through yellow and green to blue as the least connected. Edge colors show the type of assay that detected the interaction for each couple: BiFC (green), Y2H (red), and both methods (blue). The corresponding Cytoscape file is available as Supplemental Data Set 2 online.
Figure 2.
Figure 2.
Classification of Cell Cycle Proteins According to Their Connectivity in the Network per Protein Family. (A) CDKs. (B) D-type cyclins. (C) A-type cyclins. (D) B-type cyclins. (E) E2F/DP/DEL transcription factors. (F) KRPs. The number of interactions per protein is given in the ordinate.
Figure 3.
Figure 3.
Transcript Coexpression Information for the PPI Network. (A) Comparison of the binary PPI network (blue curve) with a Gaussian distribution of the randomized networks (gray curves and red line for the average of the random data sets). (B) Binary PPI network merged with pairwise coexpression data. The edge color represents the correlation in transcript expression for each pair. Red depicts highly positively correlated pairs; blue, highly anticorrelated pairs; and gray, protein pairs without significant transcript correlation (interacting pairs for which no transcriptional PCC value was available are not displayed). (C) Interaction network of highly positive transcript PCC values. (D) Interaction network with negative transcript PCC values (indicating anticorrelated expression data). Nodes in (C) and (D) are colored based on phase of the cell cycle in which the gene is expressed. The Cytoscape file corresponding to (B) is available as Supplemental Data Set 3 online and that corresponding to (C) and (D) is available as Supplemental Data Set 4 online.
Figure 4.
Figure 4.
FLIM Assay for the Selected Core Cell Cycle Protein Pairs in Vivo in Tobacco Epidermis. (A) to (F) Fluorescence intensity images acquired by FLIM are shown as gray-scale pictures (left). Lifetime images (right) are represented as pseudocolor according to the color code ranging from 1 ns (blue) to 3 ns (red). The respective lifetime values measured for KRP1-CFP expressed alone ([A] and [B] as a control in two different experiments) or with CDKA;1-Venus (D) or CKS2-Venus (E), and for CYCA2:4-CFP expressed alone (C) or with KRP1-Venus (F) are indicated on the color scales. Coexpression of two fusion proteins strongly reduces the fluorescence lifetime of the donor protein. (G) to (I) Subcellular localization of the BiFC complex between KRP1-nGFP and CYCA2;4-cGFP in tobacco epidermal cells. (G) Images show the complex localizing in bright subnuclear speckles. (H) and (I) Subcellular localization of KRP1-GFP and CYCA2;4-GFP expressed separately in tobacco epidermis.
Figure 5.
Figure 5.
Coexpression Analysis of the PPI Network. (A) Global network of interaction among all detected interacting protein pairs. The red and green loops include the G1/S and G2/M subnetworks, respectively. The node and edge colors depict the cell cycle phase when the expression of a gene peaks and the assay (green for BiFC; red for Y2H; and blue for both methods) that detected particular interaction pairs, respectively. (B) Set of G1/S proteins interacting among each other (blue-red circle) and with their first neighbors (directly interacting proteins) from other cell cycle phases. (C) G2/M proteins interacting among each other (yellow-green circle) and with their first neighbors from other cell cycle phases. (D) Constitutively expressed proteins at the nexus of cell cycle phase-specific PPIs. The Cytoscape file corresponding to this figure is available as Supplemental Data Set 5 online.
Figure 6.
Figure 6.
Localization of the Binary PPI Network. (A) Localization distribution of all 58 cell cycle proteins in tobacco leaves. MT, microtubules; ER, endoplasmic reticulum. (B) Localization distribution of all 341 cell cycle binary protein complexes in tobacco leaves. (C) Localization map of the proteins and complexes of the binary PPI network. Node colors represent the localization of single GFP-tagged proteins, and edge colors mark the localization of particular complexes. (D) Connectivity and localization network of CDKA;1 complexes. The Cytoscape file corresponding to (C) and (D) is available as Supplemental Data Set 6 online. (E) Subcellular localization of CDKA;1/cyclin complexes. Confocal images of tobacco leaves transiently expressing CDKA;1-GFP (a), CDKA;1 homodimer (b), and each of the cyclins separately ([c], [e], [g], and [i]) and the split GFP complexes formed between CDKA;1 and an appropriate cyclin ([d], [f], [h], and [j]): CYCB2;3-GFP ([c] and [d]), CYCA2;4-GFP ([e] and [f]), CYCD3;1-GFP ([g] and [h]), and CYCA1;1-GFP ([i] and [j]).

References

    1. Akada R., Yamamoto J., Yamashita I. (1997). Screening and identification of yeast sequences that cause growth inhibition when overexpressed. Mol. Gen. Genet. 254: 267–274 - PubMed
    1. Aoki K., Ogata Y., Shibata D. (2007). Approaches for extracting practical information from gene co-expression networks in plant biology. Plant Cell Physiol. 48: 381–390 - PubMed
    1. Boniotti M.B., Gutierrez C. (2001). A cell-cycle-regulated kinase activity phosphorylates plant retinoblastoma protein and contains, in Arabidopsis, a CDKA/cyclin D complex. Plant J. 28: 341–350 - PubMed
    1. Boudolf V., et al. (2009). CDKB1;1 forms a functional complex with CYCA2;3 to suppress endocycle onset. Plant Physiol. 150: 1482–1493 - PMC - PubMed
    1. Boudolf V., Vlieghe K., Beemster G.T.S., Magyar Z., Torres Acosta J.A., Maes S., Van Der Schueren E., Inzé D., De Veylder L. (2004). The plant-specific cyclin-dependent kinase CDKB1;1 and transcription factor E2Fa-DPa control the balance of mitotically dividing and endoreduplicating cells in Arabidopsis. Plant Cell 16: 2683–2692 - PMC - PubMed

Publication types

MeSH terms

Substances