

Caloric sweetener consumption and dyslipidemia among US adults
- PMID: 20407058
- PMCID: PMC3045262
- DOI: 10.1001/jama.2010.449
Caloric sweetener consumption and dyslipidemia among US adults
Abstract
Context: Dietary carbohydrates have been associated with dyslipidemia, a lipid profile known to increase cardiovascular disease risk. Added sugars (caloric sweeteners used as ingredients in processed or prepared foods) are an increasing and potentially modifiable component in the US diet. No known studies have examined the association between the consumption of added sugars and lipid measures.
Objective: To assess the association between consumption of added sugars and blood lipid levels in US adults.
Design, setting, and participants: Cross-sectional study among US adults (n = 6113) from the National Health and Nutrition Examination Survey (NHANES) 1999-2006. Respondents were grouped by intake of added sugars using limits specified in dietary recommendations (< 5% [reference group], 5%-<10%, 10%-<17.5%, 17.5%-<25%, and > or = 25% of total calories). Linear regression was used to estimate adjusted mean lipid levels. Logistic regression was used to determine adjusted odds ratios of dyslipidemia. Interactions between added sugars and sex were evaluated.
Main outcome measures: Adjusted mean high-density lipoprotein cholesterol (HDL-C), geometric mean triglycerides, and mean low-density lipoprotein cholesterol (LDL-C) levels and adjusted odds ratios of dyslipidemia, including low HDL-C levels (< 40 mg/dL for men; < 50 mg/dL for women), high triglyceride levels (> or = 150 mg/dL), high LDL-C levels (> or = 130 mg/dL), or high ratio of triglycerides to HDL-C (> 3.8). Results were weighted to be representative of the US population.
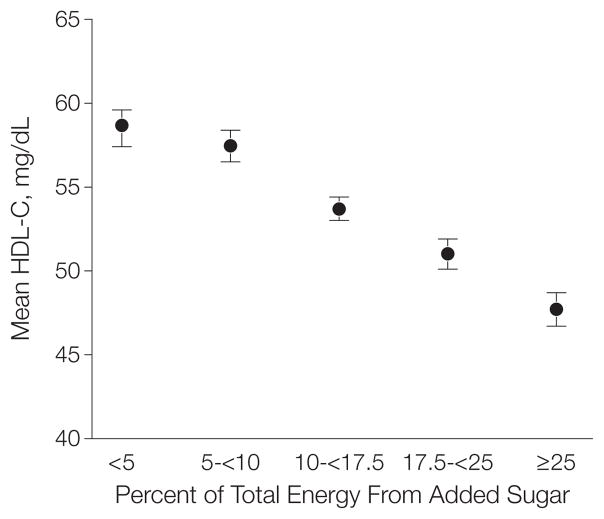
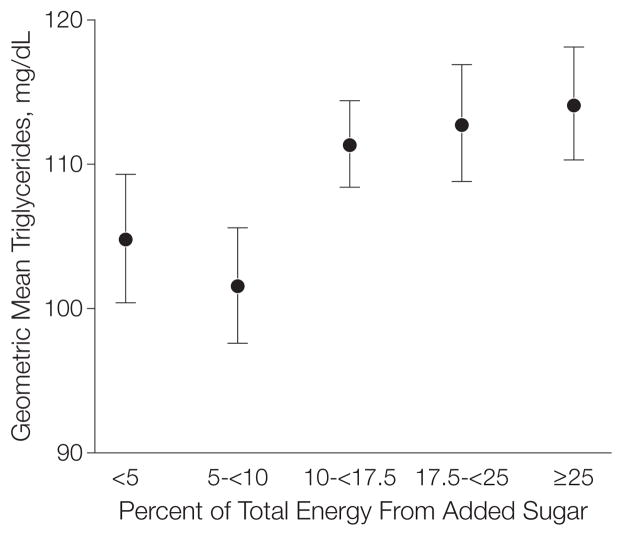
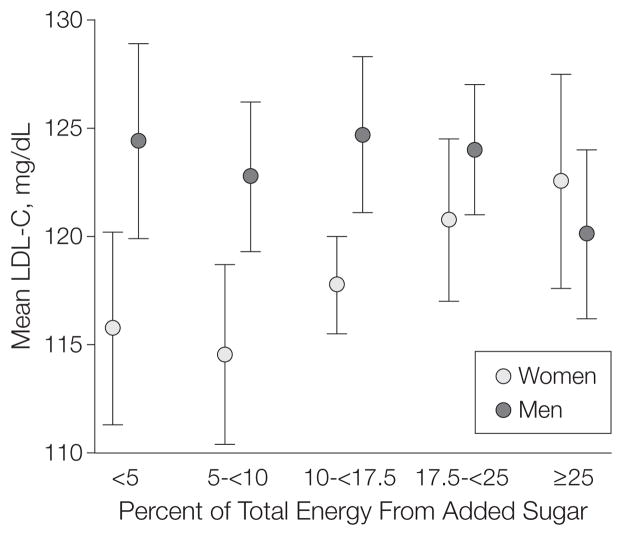
Results: A mean of 15.8% of consumed calories was from added sugars. Among participants consuming less than 5%, 5% to less than 17.5%, 17.5% to less than 25%, and 25% or greater of total energy as added sugars, adjusted mean HDL-C levels were, respectively, 58.7, 57.5, 53.7, 51.0, and 47.7 mg/dL (P < .001 for linear trend), geometric mean triglyceride levels were 105, 102, 111, 113, and 114 mg/dL (P < .001 for linear trend), and LDL-C levels modified by sex were 116, 115, 118, 121, and 123 mg/dL among women (P = .047 for linear trend). There were no significant trends in LDL-C levels among men. Among higher consumers (> or = 10% added sugars) the odds of low HDL-C levels were 50% to more than 300% greater compared with the reference group (< 5% added sugars).
Conclusion: In this study, there was a statistically significant correlation between dietary added sugars and blood lipid levels among US adults.
Figures
References
-
- National Cholesterol Education Program (NCEP) Expert Panel on Detection, Evaluation, and Treatment of High Blood Cholesterol in Adults (Adult Treatment Panel III). Third Report of the National Cholesterol Education Program (NCEP) Expert Panel on Detection, Evaluation, and Treatment of High Blood Cholesterol in Adults (Adult Treatment Panel III) Final Report. Circulation. 2002;106(25):3143–3421. - PubMed
-
- Krebs-Smith SM. Choose beverages and foods to moderate your intake of sugars: measurement requires quantification. J Nutr. 2001;131(2S-1):527S–535S. - PubMed
-
- Dietary guidelines for Americans. 6. US Department of Health & Human Services; Jan2005. [Accessed October 16, 2009]. Web site. http://www.healthierus.gov/dietaryguidelines.
-
- Sugars in our diet. European Food Information Council (EUFIC); [Accessed October 12, 2009]. Web site. http://www.eufic.org/page/en/nutrition/sugar.
Publication types
MeSH terms
Substances
Grants and funding
LinkOut - more resources
Full Text Sources
Other Literature Sources
