. 2010 Apr;235(4):531-8.
doi: 10.1258/ebm.2010.009336.

Periodic heart rate decelerations in premature infants

Affiliations

Periodic heart rate decelerations in premature infants

Abigail A Flower et al. Exp Biol Med (Maywood). 2010 Apr.

Abstract

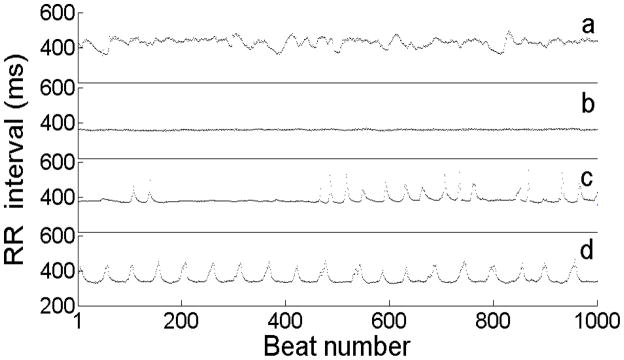
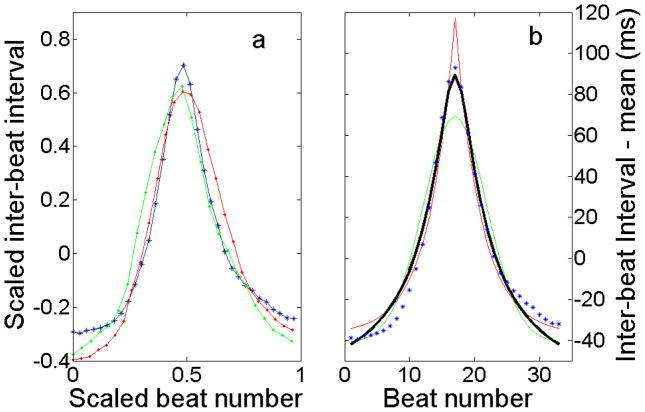
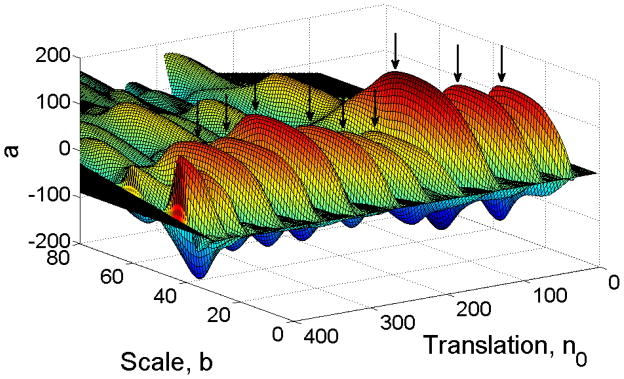
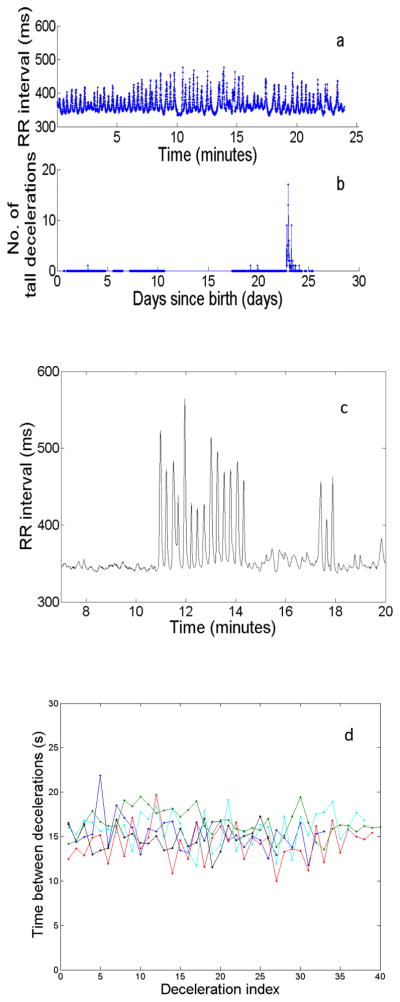
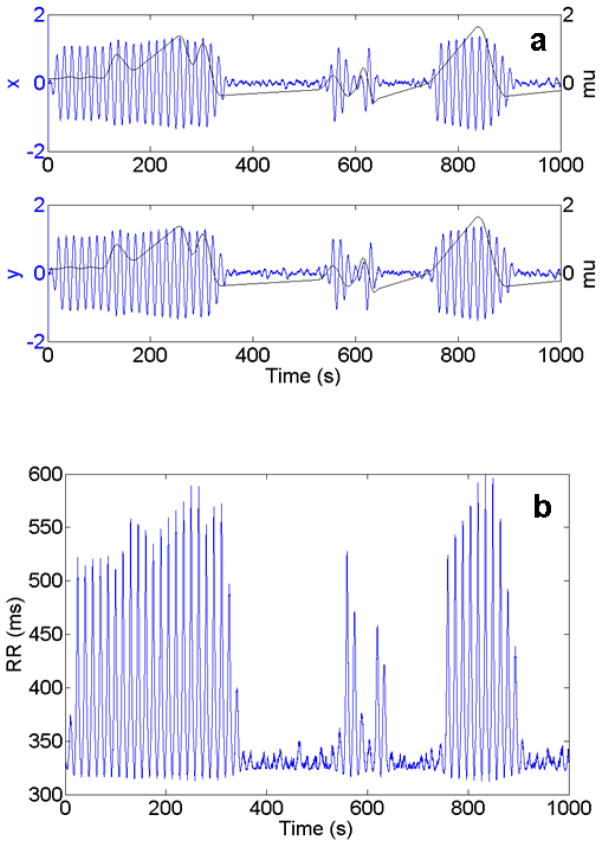
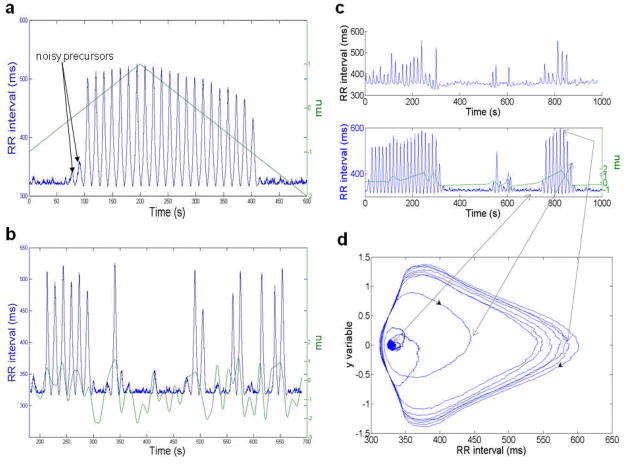
The pacemaking system of the heart is complex; a healthy heart constantly integrates and responds to extracardiac signals, resulting in highly complex heart rate patterns with a great deal of variability. In the laboratory and in some pathological or age-related states, however, dynamics can show reduced complexity that is more readily described and modeled. Reduced heart rate complexity has both clinical and dynamical significance - it may provide warning of impending illness or clues about the dynamics of the heart's pacemaking system. In this paper, we describe simple and interesting heart rate dynamics that we have observed in premature human infants - reversible transitions to large-amplitude periodic oscillations - and we show that the appearance and disappearance of these periodic oscillations can be described by a simple mathematical model, a Hopf bifurcation.


Conflict of interest statement

Required conflict of interest statement: Medical Predictive Science Corporation of Charlottesville, Virginia, has a license to market technology related to heart rate characteristics monitoring of newborn infants, supplied partial funding for this study, and aided in collection of data. They played no role in study design, analysis, and interpretation of data, or of the writing of the report or the decision to submit the paper for publication. Drs. Lake and Moorman have an equity share in this company.

Figures

Fig. 1
Fig. 1
(color online) Examples of approximately four minutes of continuous RR (interbeat) intervals from four different NICU patients. (a) RR interval series for a healthy NICU patient;(b) RR interval series for a NICU patient showing reduced heart rate variability prior to diagnosis of sepsis (bloodstream infection); (c) RR interval series for a NICU patient showing decelerations; (d) RR interval series showing part of a long cluster of periodic decelerations. Each peaked structure in (c) and (d) is termed a “deceleration.” (d) shows striking periodicity (period ~45 beats, or about 15 s), which lasted well beyond the duration of the shown excerpt; the periodic decelerations lasted over 48 hours. (This infant suffered intracranial hemorrhage with concomitant sepsis.)
Fig. 2
Fig. 2
(color online) A typical decomposition of RR interval (inter-beat interval) signal into a sum of decelerations of various widths and heights and some remainder. The red curves represent the functions a(n0,b)χ(n; n0,b). a(n0,b) describes the height of the function, n0 represents the location of the peak of the function, and b represents the width (or scale) of the function. G(n), the remaining signal after decelerations are removed, is represented in black.
Fig. 3
Fig. 3
(color online) Decelerations have a common shape that can be represented by a template function for use in a deceleration detector. (a) Three decelerations from a record scaled to width of one and height of one. (b) Standard functions are optimized to fit a deceleration: blue asterisks, data; red line, exponential; green line, Gaussian; black line, χ. A Gaussian function is too rounded, while an exponential is too sharply peaked, but χ fits the data adequately.
Fig. 4
Fig. 4
(color online) a(no,b) for a portion of neonatal heart rate data. We identify the large local maxima of the surface as decelerations (indicated by black arrows). The surface a(n0,b) was generated by sweeping the template function, χ(n0,b), through a portion of neonatal HR data at various widths (or scales), b.
Fig. 5
Fig. 5
(color online) Decelerations occur in clusters that may show periodicity. (a) Example of a cluster of tall decelerations in a half-hour record of RR. (b) For the same infant, number of tall decelerations (greater than 100 ms from peak to baseline) in a half-hour record as a function of days since birth. Each data point represents one half-hour record. Through most of the infant’s stay, there were few occurrences of tall decelerations, but a cluster occurred around Day 23. (Six hours later, this patient showed clinical signs of sepsis.) Fig. 5a is a record from the cluster occurring near day 23. Note the presence of intermittent periodicity in a. (c) A burst of decelerations arising from a state of low variability. The abrupt onset of the decelerations is indicative of a “hard” Hopf bifurcation. (d) Periodic bursts of decelerations for six NICU infants. We show time to next deceleration as a function of deceleration index. The typical time between decelerations is about 15 s.
Fig. 6
Fig. 6
(color online) (a) Output from a noisy hard Hopf model with noise coefficient, ξ, equal to 0.03, μ varying in time as shown on plot (black line), a=1/3, and b=−1/2. (Top) Variable x as a function of time. (Bottom) Variable y as a function of time. Output was produced using Equations (7) with the specified parameter values. (b) RR (t) corresponding to (x(t), y(t)) output of (a). RR (t) is calculated by converting the output (x(t), y(t)) of the noisy Hopf model into polar form, and then using Eq. (9). The behaviour of μ is identical to that in (a).
Fig. 7
Fig. 7
(color online) A noisy Hopf bifurcation model produces behavior similar to that of observed data. (a) Oscillations induced in a noisy hard Hopf bifurcation model transformed into RR intervals via a Fourier series representation of a deceleration. Oscillations arise when μ increases through zero, and terminate when μ decreases through its critical value, in this case −1 (μ plotted in green, RR intervals in blue). (b) Bursts of periodic decelerations created by allowing the parameter μ to vary near zero. Such results of simulations resemble observed data. (c) (Top) Data from a neonatal RR interval record showing bursts of periodic decelerations. (Bottom) Simulation of data produced by the noisy Hopf model. (d) A portion of the same simulation shown in coordinates (RR, y). The noisy precursors have RR ≃ 335, y ≃ 0. When μ increases through zero, that point becomes unstable, and the path quickly spirals out to a large cycle. When μ decreases through its critical point again, the path spirals back to fluctuate again about the now-stable steady state.

References

    1. Buchman TG. Nonlinear dynamics, complex systems, and the pathobiology of critical illness. Curr Opin Crit Care. 2004;10(5):378. - PubMed
    1. Buchman TG, Stein PK, Goldstein B. Heart rate variability in critical illness and critical care. Curr Opin Crit Care. 2002;8(4):311. - PubMed
    1. Glass L, Shrier A, Belair J. Chaotic cardiac rhythms. Chaos. 1986:236–256.
    1. Goldberger AL. Chaos and fractals in human physiology. Sci Am. 1990;262(2):42–49. - PubMed
    1. Goldberger AL, Peng C-K, Lipsitz LA. What is physiologic complexity and how does it change with aging and disease? Neurobiol Aging. 2002;23:23–26. - PubMed

Publication types