. 2010 Jul;185(3):841-54.
doi: 10.1534/genetics.109.113746. Epub 2010 Apr 20.

Mitotic expression of Spo13 alters M-phase progression and nucleolar localization of Cdc14 in budding yeast

Affiliations

Mitotic expression of Spo13 alters M-phase progression and nucleolar localization of Cdc14 in budding yeast

Elisa Varela et al. Genetics. 2010 Jul.

Abstract

Spo13 is a key meiosis-specific regulator required for centromere cohesion and coorientation, and for progression through two nuclear divisions. We previously reported that it causes a G2/M arrest and may delay the transition from late anaphase to G1, when overexpressed in mitosis. Yet its mechanism of action has remained elusive. Here we show that Spo13, which is phosphorylated and stabilized at G2/M in a Cdk/Clb-dependent manner, acts at two stages during mitotic cell division. Spo13 provokes a G2/M arrest that is reversible and largely independent of the Mad2 spindle checkpoint. Since mRNAs whose induction requires Cdc14 activation are reduced, we propose that its anaphase delay results from inhibition of Cdc14 function. Indeed, the Spo13-induced anaphase delay correlates with Cdc14 phosphatase retention in the nucleolus and with cyclin B accumulation, which both impede anaphase exit. At the onset of arrest, Spo13 is primarily associated with the nucleolus, where Cdc14 accumulates. Significantly, overexpression of separase (Esp1), which promotes G2/M and anaphase progression, suppresses Spo13 effects in mitosis, arguing that Spo13 acts upstream or parallel to Esp1. Given that Spo13 overexpression reduces Pds1 and cyclin B degradation, our findings are consistent with a role for Spo13 in regulating APC, which controls both G2/M and anaphase. Similar effects of Spo13 during meiotic MI may prevent cell cycle exit and initiation of DNA replication prior to MII, thereby ensuring two successive chromosome segregation events without an intervening S phase.


Figures
F<sc>igure</sc> 1.—
Figure 1.—
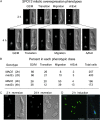
SPO13 overexpression phenotypes during mitosis. (A) Micrographs of DAPI staining and DIC images showing typical SPO13 overexpression phenotypes after 2 hr (upper) or 4 hr (lower) on galactose. (B) Quantification of the mitotic arrest phenotypes in GAL-SPO13 MAD2 (GA-3419) or GAL-SPO13 mad2 (GA-662) strains after 2 or 4 hr on galactose. The total number of cells presented for each strain stems from two independent experiments with identical phenotypic distributions. (C) Micrographs of DAPI staining and DIC images of GAL-SPO13 (GA-3419) showing the phenotypes 2 and 24 hr after transcriptional repression of GAL-SPO13 by return to raffinose-containing media (see materials and methods). (D) Immunofluorescence (IF) with anti-tubulin antibodies and DAPI staining of GAL-SPO13 (GA-3419) cells show misoriented spindles after 2 hr on galactose. Bar, 5 μm.
F<sc>igure</sc> 2.—
Figure 2.—
Analysis of SPO13 phosphorylation and stability. (A) 32P-labeled band comigrates with Spo13-Myc, which forms multiple bands on a Western blot with anti-Myc antibody (right lane, anti-Spo13, see arrows) after immunoprecipitation. The 32P-labeled precipitates were incubated in the presence or absence of the indicated phosphatases (CIP, calf intestinal phosphatase; PP2A, protein phosphatase 2A; or PTP, protein tyrosine phosphatase) with or without an excess of the appropriate phosphatase inhibitors, Na2HPO4, okadaic acid, or Na-vanadate, as indicated. (B) Western blot analysis with anti-Myc antibody on strain GAL-SPO13-13MYC cdc28-as1 (GA-4355). Spo13-Myc was expressed for 3.5 hr and then repressed by washing twice in glucose. The culture was divided and further grown on raffinose for 3.5 hr. Where indicated, the ATP analog 1NM-PP1 was added to inactivate the cdc28-as1 allele. RNase42 indicates an abundant cytoplasmic RNA helicase used as a Western blot control. (C) Western blot analysis with anti-Myc antibody on GAL-SPO13-13MYC cdc28-as1 (GA-4355) in which SPO13-Myc expression was induced with galactose in the presence or absence of the yeast pheromone α-factor, which arrests cells in G1 phase. The loading control is an unidentified protein detected by Ponceau staining of the Western blot transfer.
F<sc>igure</sc> 3.—
Figure 3.—
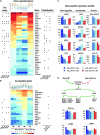
Genome-wide mRNA profiling during Spo13-dependent mitotic arrest. (A and B) Heat maps and graphical displays with signal distributions for each time point, displayed in duplicate. Data are shown for overexpression of wild type (GAL-SPO13, GA-3419) at 0 hr, 2 hr, and 4 hr, and frameshift (GAL-spo13fs, GA-4318) at 4 hr. Left dots indicate genes whose expression depends upon the specific transcription factor given at bottom. Right dots indicate participation in the biological process (given at bottom). Log2-transformed signal intensities are color coded as given in the scale. (C) Bar diagrams summarize linear signal intensities (y-axis) vs. color-coded samples (x-axis) for typical cases of down- and upregulated genes, as well as control genes. The samples are described below the graphs. (D) Model of the pathways that contribute to the Spo13-dependent sequestration or Net1-dependent release of Cdc14 from the nucleolus. Diagram shows regulation of Ace2 and Swi5 transcription factors by Cdc14, which leads to the transcription of their target genes (top). Bar diagrams below show linear expression signals for four selected genes; samples are color coded as in C.
F<sc>igure</sc> 4.—
Figure 4.—
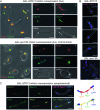
Cdc14 colocalization with Nop1 in cells expressing SPO13 or spo13fs. (A) Cells expressing GAL-SPO13 CDC14-GFP pNOP1-CFP (GA-4390) or GAL-spo13fs CDC14-GFP pNOP1-CFP (GA-4388), as indicated, were visualized after 2 hr of growth on galactose. Selected cells arrested at G2/M (a) or in anaphase (b and c) and G1 (d) are enlarged in the middle and right panels. Nop1 is shown in red, Cdc14 in green, and colocalization of the two is shown in white (coloc). (B) Immunofluorescence for Cdc14-HA and anti-Nop1 on cultures expressing either GAL-SPO13 CDC14-6HA (GA-4394) or GAL-spo13fs CDC14-6HA (GA-4393) after 2 hr of induction with galactose. Micrographs show the colocalization of Cdc14 with Nop1 in red and their coincidence with DAPI staining (blue). In all categories of Spo13-induced arrest we see colocalization of Cdc14 and Nop1 staining, whereas in spo13fs-expressing cells we see colocalization in interphase but not in anaphase cells. (C) Immunofluorescence for Cdc14-HA or anti-tubulin, each combined with anti-Nop1, in a culture expressing GAL-SPO13 CDC14-6HA (GA-4394) after 2 hr of induction with galactose. (Top) Cdc14, Nop1, and DAPI are shown in yellow, green, and blue, respectively. Colocalization of Cdc14 and Nop1 is shown in red. (Bottom) anti-tubulin in green, anti-Nop1 in yellow, DAPI stain in blue. Bar, 5 μm. The diagram shows the distribution of proteins along the extended segregating chromosomes and microtubules (green) as in the micrographs.
F<sc>igure</sc> 5.—
Figure 5.—
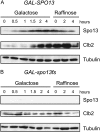
Western blot analysis of cell-cycle proteins. (A) Western blot analysis of samples at the indicated time points during galactose induction and after repression of the GAL promoter on raffinose media of GAL-SPO13 (GA-3419). Antibodies used are indicated at the right. (B) As in A, with strain GA-4318 expressing GAL-spo13fs.
F<sc>igure</sc> 6.—
Figure 6.—
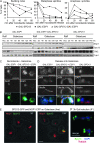
ESP1 overexpression suppresses Spo13-induced arrest. (A) Graphs show cell counts for budding index, metaphase or anaphase spindles on strains expressing GAL-SPO13, GAL-ESP1, and both GAL-SPO13 and GAL-ESP1 as well as CDC14-6HA (GA-5441, GA-5406, and GA-5230, respectively). Cells were blocked at G2/M with nocodazole and released in the presence of galactose. (B) Western blot analysis of the indicated proteins at the indicated time points from the experiment described in A. (C and D) Representative micrographs showing immunofluorescence analysis of the indicated proteins and strains either during galactose induction on nocodazole (C) or on cells released from nocodazole arrest for 40, 60, or 80 min on galactose (D). GAL-SPO13 refers to strain GA-5441, GAL-ESP1 is GA-5406, and GAL-SPO13 + ESP1 is GA-5230. Quantitation of Cdc14 release at equivalent time points is as follows: Under nocodazole arrest with overexpression of ESP1, 83%; SPO13, 19%; ESP1 SPO13, 55%; after arrest and release into galactose, ESP1, 97% (at 40 min); SPO13, 20% (at 80 min); and ESP1 SPO13, 56% (at 60 min). Between 30 and 106 cells were counted for each point. (E) Representative live fluorescence images of strain GAL-SPO13-GFP pNOP1-CFP (GA-4175) showing Nop1-CFP (red) and Spo13-GFP (green) at 10 and 120 min after shift to galactose-containing media. Bar, 2 μm. A total of 85% of cells counted show colocalization. (F) After 3 hr induction on galactose some mitotic cells show large aggregates of Spo13-GFP that do not colocalize with DNA, the nucleolus nor the spindle, detected here by immunofluorescence (red, tubulin; green, Spo13; blue, DAPI). Bar, 2 μm.
F<sc>igure</sc> 7.—
Figure 7.—
Securin (Pds1) dynamics in the presence and absence of Spo13. Strains GA-5829 (GAL-SPO13 PDS1-18Myc) and GA5826 (GAL-spo13fs PDS1-18Myc) were grown on YP+raffinose to log phase and then galactose was added to induce expression of SPO13 or spo13fs. Both cultures were analyzed by immunofluorescence at 4 hr after induction. (B) The same strains described in A were arrested at the G2/M transition with nocodazole, then nocodazole was washed out with YP raffinose and cells were released into YP galactose. Samples were taken at the indicated time point and analyzed by Western blot. Antibodies against the indicated proteins were used. Bar, 5 μm.

Similar articles

Cited by

References

    1. Azzam, R., S. L. Chen, W. Shou, G. Alexandru, K. Nasmyth et al., 2004. Phosphorylation by cyclin B-Cdk underlies release of mitotic exit activator Cdc14 from the nucleolus. Science 305 516–519. - PubMed
    1. Bishop, A. C., J. A. Ubersax, D. T. Petsch, D. P. Matheos, N. S. Gray et al., 2000. A chemical switch for inhibitor-sensitive alleles of any protein kinase. Nature 407 395–401. - PubMed
    1. Brown, N. R., M. E. Noble, J. A. Endicott and L. N. Johnson, 1999. The structural basis for specificity of substrate and recruitment peptides for cyclin-dependent kinases. Nat. Cell Biol. 1 438–443. - PubMed
    1. Buckingham, L. E., H. T. Wang, R. T. Elder, R. M. McCarroll, M. R. Slater et al., 1990. Nucleotide sequence and promoter analysis of SPO13, a meiosis-specific gene of Saccharomyces cerevisiae. Proc. Natl. Acad. Sci. USA 87 9406–9410. - PMC - PubMed
    1. Buonomo, S. B., K. P. Rabitsch, J. Fuchs, S. Gruber, M. Sullivan et al., 2003. Division of the nucleolus and its release of CDC14 during anaphase of meiosis I depends on separase, SPO12, and SLK19. Dev. Cell 4 727–739. - PubMed

Publication types

MeSH terms