. 2010 May;120(5):1722-35.
doi: 10.1172/JCI41129. Epub 2010 Apr 19.

Bestrophin-2 mediates bicarbonate transport by goblet cells in mouse colon

Affiliations

Bestrophin-2 mediates bicarbonate transport by goblet cells in mouse colon

Kuai Yu et al. J Clin Invest. 2010 May.

Abstract

Anion transport by the colonic mucosa maintains the hydration and pH of the colonic lumen, and its disruption causes a variety of diarrheal diseases. Cholinergic agonists raise cytosolic Ca2+ levels and stimulate anion secretion, but the mechanisms underlying this effect remain unclear. Cholinergic stimulation of anion secretion may occur via activation of Ca2+-activated Cl- channels (CaCCs) or an increase in the Cl- driving force through CFTR after activation of Ca2+-dependent K+ channels. Here we investigated the role of a candidate CaCC protein, bestrophin-2 (Best2), using Best2-/- mice. Cholinergic stimulation of anion current was greatly reduced in Best2-/- mice, consistent with our proposed role for Best2 as a CaCC. However, immunostaining revealed Best2 localized to the basolateral membrane of mucin-secreting colonic goblet cells, not the apical membrane of Cl--secreting enterocytes. In addition, in the absence of HCO3-, cholinergic-activated current was identical in control and Best2-/- tissue preparations, which suggests that most of the Best2 current was carried by HCO3-. These data delineate an alternative model of cholinergic regulation of colonic anion secretion in which goblet cells play a critical role in HCO3- homeostasis. We therefore propose that Best2 is a HCO3- channel that works in concert with a Cl:HCO3- exchanger in the apical membrane to affect transcellular HCO3- transport. Furthermore, previous models implicating CFTR in cholinergic Cl- secretion may be explained by substantial downregulation of Best2 in Cftr-/- mice.


Figures

Figure 1
Figure 1. Best2 reporter expression in Best2–/– mouse colon.
(A and B) Lac-Z staining of whole-mount preparations from 2-month-old (A) and 3-week-old (B) Best2–/– mice. The colon was dissected from anus to cecum, opened by a longitudinal incision, fixed with 4% buffered paraformaldehyde, and stained with X-gal. Positive blue staining occurred in a gradient from cecum to most distal colon. Scale bars: 1 cm. (C) Frozen section of distal colon of 2-month-old mouse stained for Lac-Z. Lac-Z–positive nuclei were visible throughout the crypts. Scale bar: 100 μm. (D) Western blot of Best2 expression. HEK, untransfected HEK cells (negative control); HEK-Best2, HEK cells transfected with Best2 (positive control); WT and KO colon, an approximatey 1-cm piece of colonic mucosa approximately 1 cm from the anus of a WT and a Best2–/– mouse, respectively. Blot was stained with antibody to Best2 (58 kDa) and antibody to GAPDH as a loading control (37 kDa).
Figure 2
Figure 2. Localization of Best2 in mouse and human colon.
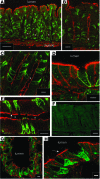
Frozen sections of paraformaldehyde-fixed mouse (AF) and human (G and H) distal colon were stained with antibody against Best2 (green) and counterstained with phalloidin to stain actin (AD, G, and H; red) or antibody against CFTR (E; red). (A) Low-power longitudinal section showing Best2-positive cells scattered throughout the crypt. Asterisks denote the base of the lumen of several crypts. (BD) Higher-magnification view of crypts (asterisks denote lumen) showing Best2 localization in the basolateral membrane of a subset of cells. (E) CFTR and Best2 antibodies stained different cell types in the crypt. The apical membrane of enterocytes in the crypt (asterisks denote lumen) stained with CFTR antibody, whereas Best2 antibody stained the basolateral membrane of CFTR-negative cells. (F) Specificity of Best2 antibody staining was demonstrated by its absence in Best2–/– mice. (G and H) Low- and high-power views of BEST2-positive cells in human colon. Arrow indicates brush border membrane. BEST2 staining was evident on basolateral membranes and also in intracellular organelles. Scale bars: 50 μm (A and F); 20 μm (B); 10 μm (C, E, and G); 5 μm (D and H).
Figure 3
Figure 3. Best2 is expressed in goblet cells.
(AC) Superimposed confocal images of colon section stained with Best2 (green) and Muc-2 (A; red), SNA (B; red), and MAL-II (C; red). (DG) Immunoelectron microscopic localization of Best2 in goblet cells of mouse colon. (D and E) Low-magnification views of goblet cells in WT (D) and Best2–/– (E) colon. (F and G) WT colon. Best2 immunogold particles were localized along basolateral plasma membrane (arrows) and rough endoplasmic reticulum (arrowheads) of goblet cells. mu, mucin. Scale bars: 10 μm (A and C); 20 μm (B); 5 μm (D and E); 0.5 μm (F and G).
Figure 4
Figure 4. Isc in WT and Best2–/– distal colonic mucosa.
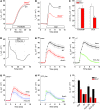
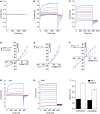
Upward currents represent anion movement from serosa to lumen. (A and B) Representative Isc in response to 10 μM forskolin (A) and 1 mM CCh (B) in WT and Best2–/– mice. (C) Peak Isc amplitudes to forskolin or CCh in WT and Best2–/– mice (n = 6–10). *P < 0.05 versus WT, Student’s t test. (DI) Isc mediated by Cl and HCO3. Solutions contained 5 mM Ba2+ and 0.1 mM amiloride. (D) Effect of HCO3 removal on CCh-stimulated current in WT mucosa. In normal Krebs solution, CCh induced a rapid peak followed by plateau. HCO3 removal inhibited the plateau. (E) Average Isc in WT and Best2–/– mice. CCh was added at 2 minutes. (F and G) CCh-stimulated current in WT (F) and Best2–/– (G) mucosa in normal Krebs and HCO3-free solutions. (H) Replot of data in F and G comparing Cl currents in HCO3-free Krebs in WT and Best2–/– mice. (I) Comparison of Cl and HCO3 currents stimulated by CCh in WT and Best2–/– mucosa. Total, current in normal Krebs; Cl, Cl current in HCO3-free solution; HCO3(P), amplitude of plateau current 8 minutes after CCh application in normal Krebs; HCO3(D), difference between currents at peak (about 1–2 minutes after CCh application) in normal Krebs and in HCO3-free solution. n = 10 per data point.
Figure 5
Figure 5. Best2 expression in colon from Cftr–/– mice.
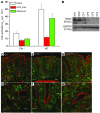
(A) Isc from Cftr–/– and WT mice, recorded as in Figure 4. Shown are results with normal Krebs and HCO3-free solutions as well as the difference between them. n = 5 mucosal samples from 2 WT mice; n = 9 mucosal samples from 4 Cftr–/– mice. P < 0.01, all Cftr–/– versus all respective WT values. (B) Western blot of Best2 expression in WT (WT1 and WT2) and Cftr–/– (CF1–CF4) colon samples. Samples were the same ones used for Isc measurements in A. Blots were stained with Best2 (58 kDa) and GAPDH (37 kDa) antibodies. (CH) Immunofluorescence of WT (C and D) and Cftr–/– (EH) colon samples. Samples are adjacent tissue from the same colons used for Isc measurements in A. Arrowheads in E and F indicate interstitial accumulation of Best2 staining; asterisks in D, F, and H are shown for comparison of Best2 staining in the cytoplasm for comparison. Scale bars: 20 μm (C, E, and G); 10 μm (D, F, and H).
Figure 6
Figure 6. Pharmacology of Best2 and Ano1 expressed in HEK293 cells.
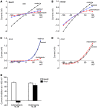
(AD) Representative current-voltage curves of Best2 (A and B) and Ano1 (C and D) currents before application (control), during extracellular application of 10 μM clotrimazole (A and C) or indomethacin (B and D), and after 2-minute washout. (E) Percent inhibition of Best2 and Ano1 currents at +100 mV by 10 μM indomethacin or clotrimazole. Currents were activated by approximately 0.6 μM [Ca2+]i in the pipette solution. Data shown are typical of 5 experiments.
Figure 7
Figure 7. Anion currents recorded from freshly isolated colonocytes and transfected HEK293 cells.
(AC) Sample traces from isolated colonocytes with less than 20 nM free [Ca2+]i (A) or 1 μM [Ca2+]i (B and C), showing different waveforms observed in different cells. (D) Current-voltage relationships for WT colonocytes with less than 20 nM free [Ca2+]i as well as WT and Best2–/– colonocytes with 1 μM free [Ca2+]i. (E) Comparison of current-voltage relationships of outwardly rectifying currents as in B from WT and Best2–/– mice with 1 μM free [Ca2+]i. (F) Comparison of current-voltage relationships of linear currents as in C from WT and Best2–/– mice with 1 μM free [Ca2+]i. (G) Representative currents in HEK cells transfected with Ano1 cDNA with 1 μM free [Ca2+]i. (H) Representative currents in HEK cells transfected with Best2 cDNA with 1 μM free [Ca2+]i. (I) Permeability and conductance, relative to Cl, of Ano1 and Best2 currents.
Figure 8
Figure 8. Expression of anoctamins in colon.
(A) RT-PCR of Ano1–Ano10 from mouse distal colonic epithelium. (B) Western blot of Ano1 expression in untransfected HEK cells, HEK cells transfected with Ano1 cDNA, distal colon, and salivary gland. (C) Confocal microscopy of Ano1 expression in colon. Brush border lumen is at the top. Asterisks mark the bottom of the crypt. Interstitial cells and the brush border are denoted by white and red arrows, respectively. Shown are Ano1 and phallodin alone as well as the overlay (left).
Figure 9
Figure 9. Phenotype of Best2–/– mice.
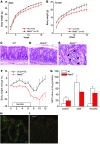
(A and B) Body weights of male (A) and female (B) WT and Best2–/– mice plotted versus age. (CE) Hematoxylin and eosin–stained sections of WT (C) and Best2–/– (D and E) colon. The circle in D indicates an area of inflammation characterized by many polymorphonuclear lymphocytes. Arrows in E denote lymphocytes (black) and an eosinophil (yellow). (FI) Response to DSS treatment. (F) Body weights of WT and Best2–/– mice given 3% DSS in their drinking water from day 1 to day 7 (n = 18 per group). (G) MPO activity in colon samples from WT and Best2–/– mice before DSS treatment (control), at the end of 6 days of DSS treatment (DSS), and 18 days after DSS treatment was ended (recovery) (n = 6–10 per group). *P < 0.05. (H and I) Cells of WT and Best2–/– distal colon, after 6 days of recovery from DSS, were stained with Best2 antibody (green) and PNA (red) to show unsialylated mucin. Scale bar: 20 μm. Images demonstrate hyperplasia of Best2-positive cells (H), whereas Best2–/– mice had many fewer PNA-positive cells (I).
Figure 10
Figure 10. Ion transport in distal colon.
(A) Transporters and channels in colon. The distribution of channels and transporters was determined by immunofluorescence confocal microscopy. Secretion occurs in the crypt, and absorption occurs at the luminal brush border. Secretion is driven by transepithelial Cl transport that occurs by active basolateral uptake of Cl by the Na+/K+/2Cl cotransporter NKCC1 (blue) and subsequent passive efflux via apical CFTR Cl channels (green). Cl transport is accompanied — paracellularly and possibly transcellularly — by H2O and and Na+ (gray). Na+ and Cl are then reabsorbed at the brush border surface by coupled Na+-H+ exchange (by NHE3; orange) and Cl-HCO3 exchange (by SLC26A3; magenta) coupled to carbonic anhydrase (CA). Best2 (brown) is expressed basolaterally in goblet cells. Na+ is also reabsorbed by the ENaC (not shown). HCO3 is taken up by basolateral NBCe1 (pink), but apical mechanisms are not clear. (B) Interaction of goblet cells and enterocytes. Goblet cells (brown) are hypothesized to secrete HCO3 by transcellular transport involving Best2 in the basolateral membrane and a Cl:HCO3 transporter in the apical membrane (see Discussion). Enterocytes (blue) secrete Cl by transcellular transport involving basolateral NKCC1 and apical CFTR.

Similar articles

Cited by

References

    1. Heitzmann D, Warth R. Physiology and pathophysiology of potassium channels in gastrointestinal epithelia. Physiol Rev. 2008;88(3):1119–1182. doi: 10.1152/physrev.00020.2007. - DOI - PubMed
    1. Kunzelmann K, Mall M. Electrolyte transport in the mammalian colon: mechanisms and implications for disease. Physiol Rev. 2002;82(1):245–289. - PubMed
    1. Barrett KE, Keely SJ. Chloride secretion by the intestinal epithelium: molecular basis and regulatory aspects. Annu Rev Physiol. 2000;62:535–572. doi: 10.1146/annurev.physiol.62.1.535. - DOI - PubMed
    1. Musch MW, Arvans DL, Wu GD, Chang EB. Functional coupling of the downregulated in adenoma Cl–/base exchanger DRA and the apical Na+/H+ exchangers NHE2 and NHE3. Am J Physiol Gastrointest Liver Physiol. 2009;296(2):G202–G210. doi: 10.1152/ajpgi.90350.2008. - DOI - PMC - PubMed
    1. Greger R. Role of CFTR in the colon. Annu Rev Physiol. 2000;62:467–491. doi: 10.1146/annurev.physiol.62.1.467. - DOI - PubMed

Publication types