. 2010 May;120(5):1736-48.
doi: 10.1172/JCI38061. Epub 2010 Apr 19.

LPCAT1 regulates surfactant phospholipid synthesis and is required for transitioning to air breathing in mice

Affiliations

LPCAT1 regulates surfactant phospholipid synthesis and is required for transitioning to air breathing in mice

James P Bridges et al. J Clin Invest. 2010 May.

Erratum in

  • J Clin Invest. 2010 Jun 1;120(6):2248

Abstract

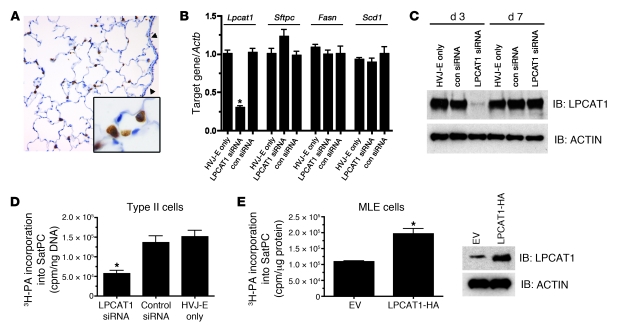
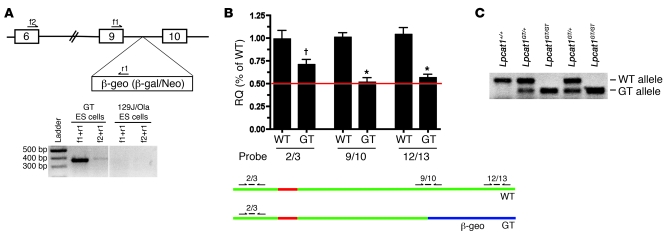
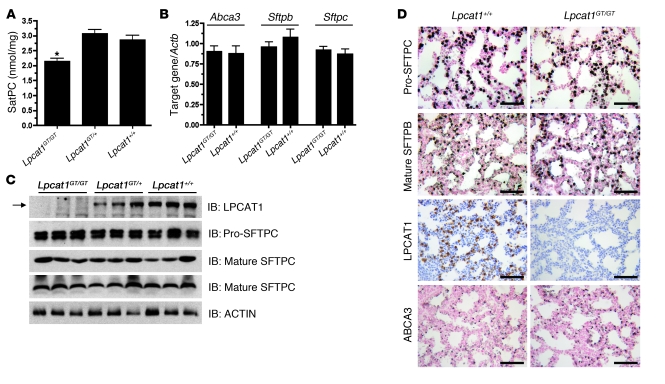
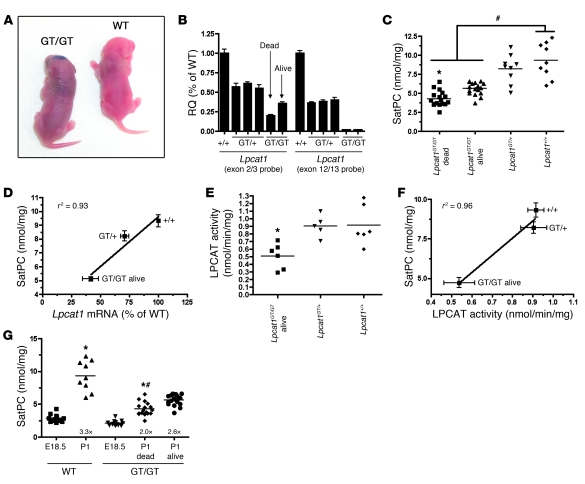
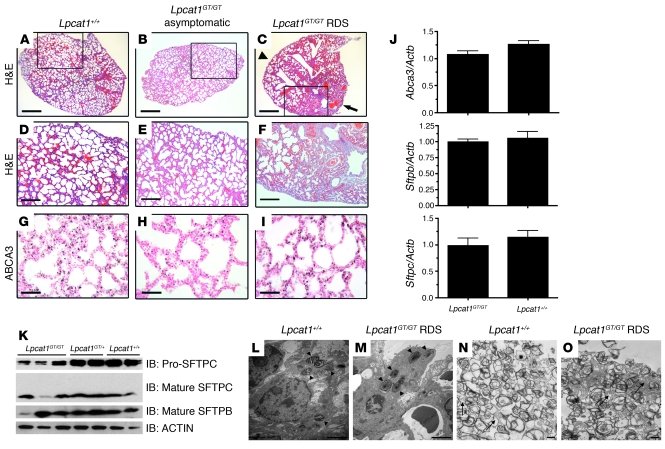
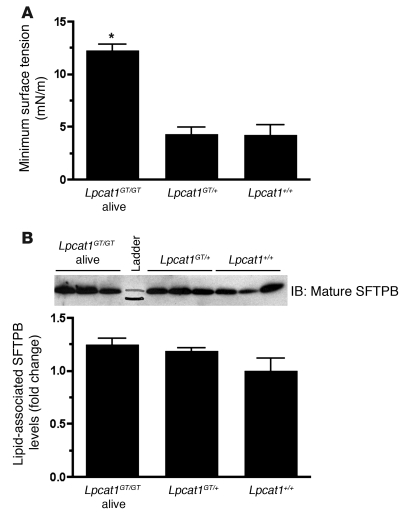
Respiratory distress syndrome (RDS), which is the leading cause of death in premature infants, is caused by surfactant deficiency. The most critical and abundant phospholipid in pulmonary surfactant is saturated phosphatidylcholine (SatPC), which is synthesized in alveolar type II cells de novo or by the deacylation-reacylation of existing phosphatidylcholine species. We recently cloned and partially characterized a mouse enzyme with characteristics of a lung lysophosphatidylcholine acyltransferase (LPCAT1) that we predicted would be involved in surfactant synthesis. Here, we describe our studies investigating whether LPCAT1 is required for pulmonary surfactant homeostasis. To address this issue, we generated mice bearing a hypomorphic allele of Lpcat1 (referred to herein as Lpcat1GT/GT mice) using a genetrap strategy. Newborn Lpcat1GT/GT mice showed varying perinatal mortality from respiratory failure, with affected animals demonstrating hallmarks of respiratory distress such as atelectasis and hyaline membranes. Lpcat1 mRNA levels were reduced in newborn Lpcat1GT/GT mice and directly correlated with SatPC content, LPCAT1 activity, and survival. Surfactant isolated from dead Lpcat1GT/GT mice failed to reduce minimum surface tension to wild-type levels. Collectively, these data demonstrate that full LPCAT1 activity is required to achieve the levels of SatPC essential for the transition to air breathing.


Figures

Figure 1
Figure 1. LPCAT1 is a type II transmembrane protein localized to the ER.
(A) HEK293 cells transfected with LPCAT-HA or LPCAT-FLAG were costained with α-HA and α-CALR or α-FLAG and α-CALR. Note the localization of LPCAT-HA and LPCAT-FLAG proteins to the ER. Scale bars: 10 μm. (B) Hydropathy plot of mouse LPCAT1 protein as predicted from the TMpred algorithm. Scores greater than 500 (red line) are considered hydrophobic. A single TMD is predicted, encompassing amino acids 53–74. Bottom panel: Diagram depicts the position of the TMD of LPCAT1 protein relative to the acyltransferase (PlsC) domain. (C) Membrane fractionation assay on HEK293 cells expressing LPCAT1-HA. Pellet (P) and supernatant (S) fractions were isolated after incubation of the membranes in the listed additives and subjected to immunoblot analysis with α-HA antibody. Blots were stripped and reprobed with an antibody against endogenous CANX, an ER-resident transmembrane protein. (D) Trypsin protection assay. Microsomes isolated from HEK293 cells transiently expressing LPCAT-HA or LPCAT-FLAG were incubated with buffer only, trypsin, or trypsin plus Triton X-100 and subjected to immunoblot analysis. Note the approximate 5-kDa shift of the LPCAT-HA protein in the presence of trypsin (IB: HA and IB: LPCAT1) and failure to detect LPCAT-FLAG in the presence of trypsin (IB: FLAG), indicating a type II orientation. A model depicting LPCAT1 in a type II orientation within a microsome is shown on the right.
Figure 2
Figure 2. His135 is critical for LPCAT1 activity.
(A) Acyltransferase activity assays were conducted by incubating 150 μM lysoPC and 25 μM 1-14C-palmitoyl-CoA with 20 μg of lysates from cells transfected with empty vector (EV), wild-type LPCAT1 (LPCAT1 WT), or LPCAT1 with an alanine substitution for histidine at amino acid position 135 (LPCAT1 H135A). The complete abrogation of acyltransferase activity by the substitution of alanine for histidine identifies it as a critical residue. Data represent activities from 3 independent experiments with each group assayed in triplicate. *P < 0.001 versus EV. (B) Immunoblot analysis of whole cell lysates from A with α-HA and α-LPCAT1 antibodies. Note similar levels of expression of WT and H135A LPCAT1. (C) Subcellular localization of LPCAT WT and LPCAT H135A to ER in HEK293 cells. Merged images demonstrate colocalization (yellow) of HA epitope (red) and an ER marker, CALR (green). Scale bars: 10 μm. (D) Diagram depicting type II orientation of LPCAT1 in ER membrane with amino terminus (blue) in cytosol, a single-pass TMD (red) spanning the lipid bilayer, and carboxyl terminus (green) in ER lumen. Note the localization of His135 (H135) in ER lumen.
Figure 3
Figure 3. LPCAT1 is required for SatPC synthesis in alveolar type II cells.
(A) Immunohistochemistry of adult mouse lung with α-LPCAT1 antibody demonstrating restricted expression in alveolar type II cells. Note robust staining in alveolar type II cells (inset) and absence of signal in the proximal epithelium (arrowheads). Original magnification, ×40; inset magnification, ×100. (B) qPCR analysis of Lpcat1, Sftpc, Fasn, and Scd1 mRNA in primary mouse type II cells after treatment with LPCAT1 siRNA or a scrambled control siRNA (con siRNA) for 48 hours. Gene expression was normalized to Actb mRNA. Data represent 5 independent experiments with each group assayed in triplicate. *P < 0.01 versus HVJ-E only. (C) Immunoblot analysis of LPCAT1 from whole cell lysates described in B with α-LPCAT1 antibody at days 3 and 7 after siRNA administration. (D) Primary alveolar type II cells were cultured in the presence of siRNAs as outlined in B and labeled with [3H]palmitic acid (3H-PA). Palmitic acid incorporation into SatPC was measured and normalized to genomic DNA. Depletion of Lpcat1 mRNA significantly reduced [3H]palmitate incorporation into SatPC. Data represent 3 independent experiments; *P < 0.01 versus control siRNA or HVJ-E only. (E) MLE15 cells expressing empty vector or LPCAT-HA were labeled with [3H]palmitic acid. Palmitic acid incorporation into SatPC was significantly increased by expression of LPCAT1. Right: Increased expression of LPCAT1 in transfected cells. Data are pooled from 3 independent experiments, each performed in triplicate; *P = 0.006 versus EV.
Figure 4
Figure 4. Confirmation of Lpcat1 GT in ES cells and generation of mice.
(A) Top: Diagram of Lpcat1 locus. Boxes denote exons, and intervening lines denote introns. The β-geo selection cassette encoding a β-galactosidase/neomycin fusion protein was inserted in intron 9, approximately 400 bp 3′ of exon 9. f1, f2, and r2 denote primers used to confirm the presence of GT cassette in the Lpcat1 locus by qPCR analysis. Bottom: PCR analysis of the Lpcat1 locus in GT ES cells or parental ES cells (129J/Ola) using 2 separate primer sets. The presence of amplicons in GT ES cells with the absence of signal in parental cells demonstrates trapping of the Lpcat1 locus at exon 9. Vertical line indicates discontinuous lanes in the same gel. (B) qPCR analysis of GT ES cells. cDNA from GT ES cells (GT) and parental cells (WT) was subjected to qPCR analysis using 3 separate exon-spanning TaqMan primer/probe sets for Lpcat1 as depicted in the bottom panel: 2/3, 9/10, and 12/13. Data were normalized to Actb and represent 3 independent experiments, each performed in triplicate. Note the difference in signal between 2/3 probe and 9/10 probe in GT cells. P < 0.05 versus 9/10 and 12/13 GT;*P < 0.05 versus 2/3 WT. RQ, relative quantification. (C) Multiplex PCR genotyping of genomic DNA from progeny of Lpcat1GT/+ intercrosses. Amplicon for WT allele is approximately 350 bp; GT, approximately 300 bp.
Figure 5
Figure 5. Lung SatPC content is decreased in E18.5 Lpcat1GT/GT mice.
(A) Measurement of lung tissue SatPC content in E18.5 mice demonstrates that Lpcat1GT/GT lungs contain significantly less SatPC. Data represent n = 5 per genotype and are normalized to tissue weight. *P < 0.01 versus Lpcat1+/+ and Lpcat1GT/+. (B) qPCR analysis of Abca3, Sftpb, and Sftpc from lung tissue of E18.5 mice shows that expression of these genes is unchanged. Data represent n = 5 for each genotype and are normalized to Actb. (C) Immunoblot analysis of lung homogenate from E18.5 mice using antisera directed against the C terminus of LPCAT1 (Mr ~60 kDa), pro-SFTPC (Mr ~21 kDa), the mature peptide of SFTPC (Mr ~4 kDa), or the mature peptide of SFTPB (Mr ~16 kDa, nonreduced). The blot for mature SFTPB was stripped and reprobed with α-ACTIN as a loading control. Note the lack of LPCAT1 immunoreactivity in Lpcat1GT/GT mice (arrow) and no change in pro-SFTPC, mature SFTPC, or mature SFTPB protein. (D) Immunohistochemical analysis of pro-SFTPC, mature SFTPB, LPCAT1, and ABCA3 in lung sections from Lpcat1GT/GT and Lpcat1+/+ mice confirms the results in C. Scale bars: 50 μm.
Figure 6
Figure 6. Perinatal mortality in Lpcat1GT/GT mice correlates with SatPC content and LPCAT1 activity.
(A) Cyanotic appearance of a newborn Lpcat1GT/GT mouse compared with wild-type littermate. (B) qPCR analysis of lung tissue from individual newborn mice using 2 primer/probe sets for Lpcat1. Data were normalized to Actb; each bar represents a single animal, and error bars represent error within technical replicates. Note the decreased amount of Lpcat1 in dead versus alive mice as detected with an exon 2/3 probe, suggesting variable mRNA stability. (C) Tissue SatPC content in newborn mice. Data represent n = 17 per genotype for Lpcat1GT/GT dead and alive, n = 9 for Lpcat1GT/+ and Lpcat1+/+. *P < 0.05 versus Lpcat1GT/GT alive; #P < 0.001 versus Lpcat1GT/GT dead and alive. (D) SatPC correlates with Lpcat1 mRNA in newborn mice. Lpcat1 mRNA was detected by qPCR using the exon2/3 primer/probe set and normalized to Actb. Data represent n = 9 for each genotype, and both assays were performed on lung tissue from the same animal. (E) Acyltransferase activity assays from lung tissue of newborn mice. Lpcat1GT/GT mice had significantly less acyltransferase activity than controls. Data represent n = 5 per genotype. *P < 0.05 versus Lpcat1+/+ mice. (F) SatPC content correlates with LPCAT1 activity in newborn mice. Data represent n = 5 for each genotype. (G) Tissue SatPC levels in E18.5 and P1 mice. Note the 3.3-fold increase in SatPC in Lpcat1+/+ mice from E18.5 to P1 versus 2.0-fold and 2.6-fold increases in Lpcat1GT/GT dead and alive mice, respectively. *P < 0.001 versus E18.5 of respective genotype; #P < 0.01 versus P1 Lpcat1GT/GT alive mice.
Figure 7
Figure 7. Analysis of surfactant-associated proteins in newborn Lpcat1GT/GT mice.
(AF). H&E-stained lung tissue sections from newborn Lpcat1GT/GT mice that succumbed from RDS, showing areas of atelectasis and hemorrhaging (C, arrow) compared with less-affected areas in the same lung (C, arrowhead) and lungs of asymptomatic Lpcat1GT/GT (B) and wild-type littermates (A). (DF) High-power magnifications of areas boxed in AC. ABCA3 protein levels were assessed by immunostaining (GI). Scale bars: 500 μm (AC), 100 μm (DF), 50 μm (GI). (J) qPCR analysis of Abca3, Sftpb, and Sftpc from lung tissue of newborn mice. Data represent n = 5 for each genotype and were normalized to Actb. (K) Immunoblot analysis of lung homogenate from newborn mice using antisera directed against pro-SFTPC (Mr ~21 kDa), the mature peptide of SFTPC (Mr ~4 kDa), or the mature peptide of SFTPB (Mr ~16 kDa, nonreduced). The blot for mature SFTPB was stripped and reprobed with α-ACTIN as a loading control. (LO) Representative transmission electron micrograph of lung tissue from a newborn Lpcat1GT/GT RDS mouse and a Lpcat1+/+ littermate control. Note the numerous lamellar bodies in alveolar type II cells (arrowheads, L and M) and abundant luminal surfactant and tubular myelin structures (arrows, N and O) in both genotypes. Scale bars: 2 μm (LO).
Figure 8
Figure 8. Surfactant isolated from Lpcat1GT/GT mice fails to reduce minimum surface tension to wild-type levels.
(A) Surface tension–lowering properties of lung surfactant isolated from newborn mice was measured on a captive bubble surfactometer. Minimum surface tensions of surfactant preparations isolated from Lpcat1GT/GT alive mice were significantly higher than those of Lpcat1GT/+ and Lpcat1+/+ mice. Data represent at least n = 5 per genotype. *P < 0.001 versus Lpcat1+/+ and Lpcat1GT/+. (B) Immunoblot analysis of phospholipid-associated mature SFTPB from an aliquot of samples used for captive bubble surfactometer analysis in A. Input was normalized to 40 nmol of total phospholipid. Graph represents densitometry of immunoblot. Levels of surfactant-associated, mature SFTPB protein were similar among all genotypes.

Similar articles

Cited by

References

    1. Gregory TJ, et al. Surfactant chemical composition and biophysical activity in acute respiratory distress syndrome. J Clin Invest. 1991;88(6):1976–1981. doi: 10.1172/JCI115523. - DOI - PMC - PubMed
    1. Schmidt R, et al. Time-dependent changes in pulmonary surfactant function and composition in acute respiratory distress syndrome due to pneumonia or aspiration. Respir Res. 2007;8:55. doi: 10.1186/1465-9921-8-55. - DOI - PMC - PubMed
    1. Hallman M, Spragg R, Harrell JH, Moser KM, Gluck L. Evidence of lung surfactant abnormality in respiratory failure. Study of bronchoalveolar lavage phospholipids, surface activity, phospholipase activity, and plasma myoinositol. J Clin Invest. 1982;70(3):673–683. - PMC - PubMed
    1. Pison U, et al. Surfactant abnormalities in patients with respiratory failure after multiple trauma. Am Rev Respir Dis. 1989;140(4):1033–1039. - PubMed
    1. Gunther A, et al. Surfactant alterations in severe pneumonia, acute respiratory distress syndrome, and cardiogenic lung edema. Am J Respir Crit Care Med. 1996;153(1):176–184. - PubMed

Publication types