. 2010 Sep;105(9):2060-71.
doi: 10.1038/ajg.2010.141. Epub 2010 Apr 20.

Autoantibodies against the exocrine pancreas in autoimmune pancreatitis: gene and protein expression profiling and immunoassays identify pancreatic enzymes as a major target of the inflammatory process

Affiliations

Autoantibodies against the exocrine pancreas in autoimmune pancreatitis: gene and protein expression profiling and immunoassays identify pancreatic enzymes as a major target of the inflammatory process

J-Matthias Löhr et al. Am J Gastroenterol. 2010 Sep.

Erratum in

  • Am J Gastroenterol. 2011 Dec;106(12):2209. Jesnowski, Ralf [corrected to Jesenofsky, Ralf]

Abstract

Objectives: Autoimmune pancreatitis (AIP) is thought to be an immune-mediated inflammatory process, directed against the epithelial components of the pancreas. The objective was to identify novel markers of disease and to unravel the pathogenesis of AIP.

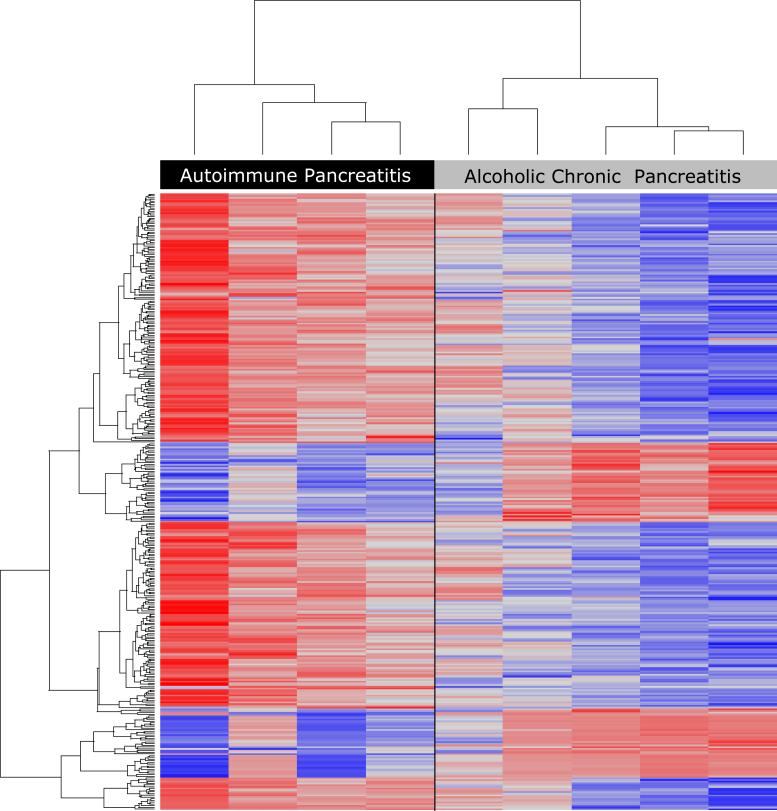
Methods: To explore key targets of the inflammatory process, we analyzed the expression of proteins at the RNA and protein level using genomics and proteomics, immunohistochemistry, western blot, and immunoassay. An animal model of AIP with LP-BM5 murine leukemia virus-infected mice was studied in parallel. RNA microarrays of pancreatic tissue from 12 patients with AIP were compared with those of 8 patients with non-AIP chronic pancreatitis.

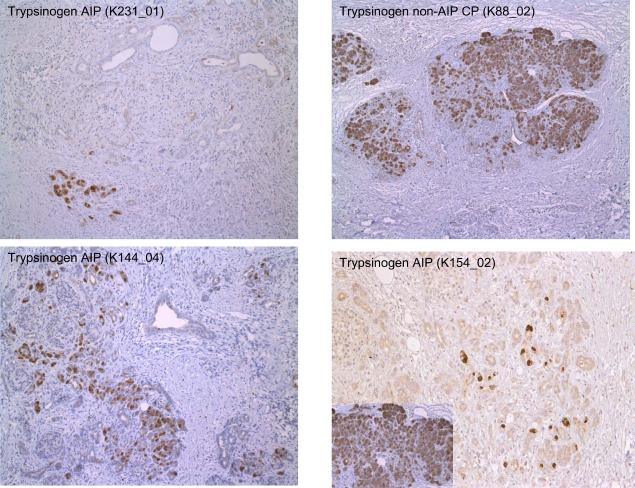
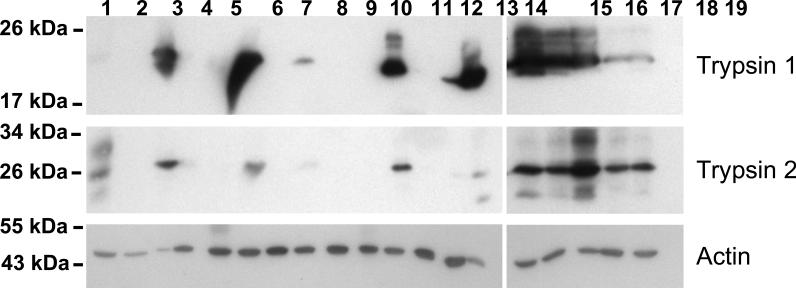
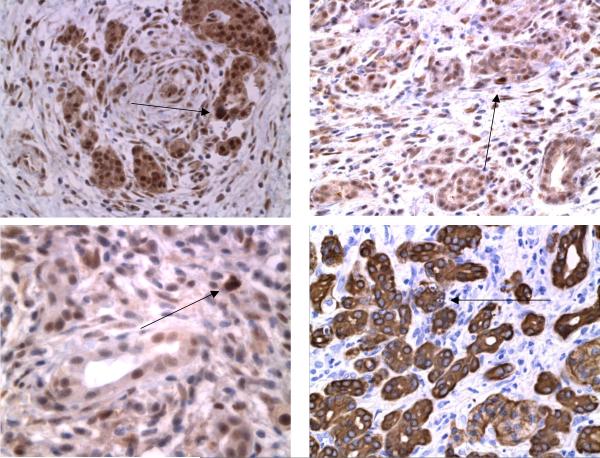
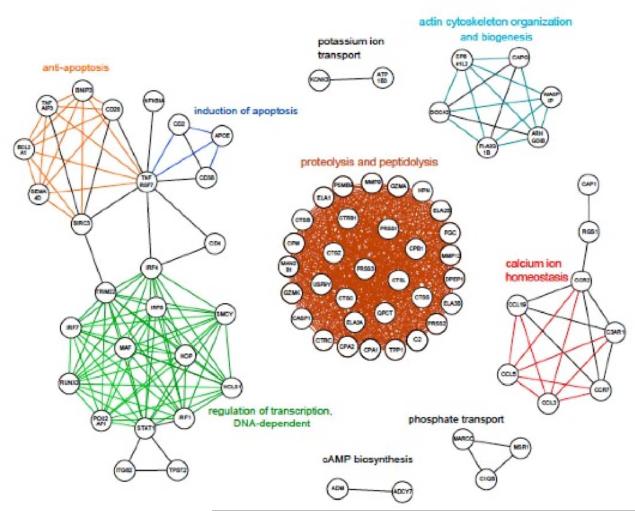
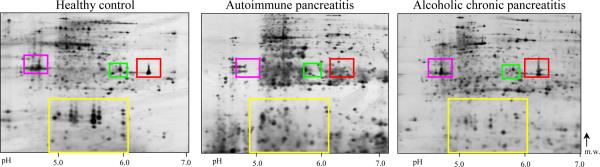
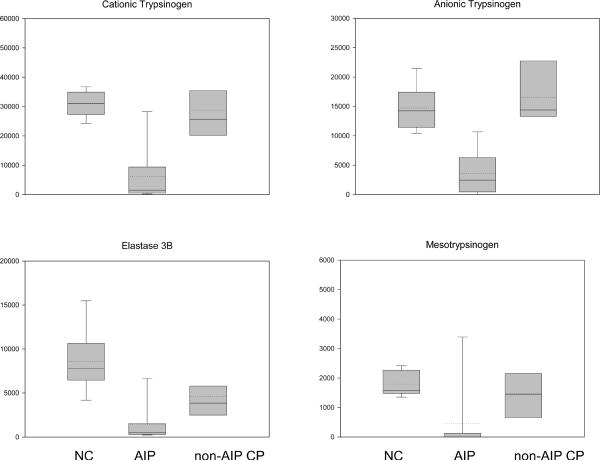
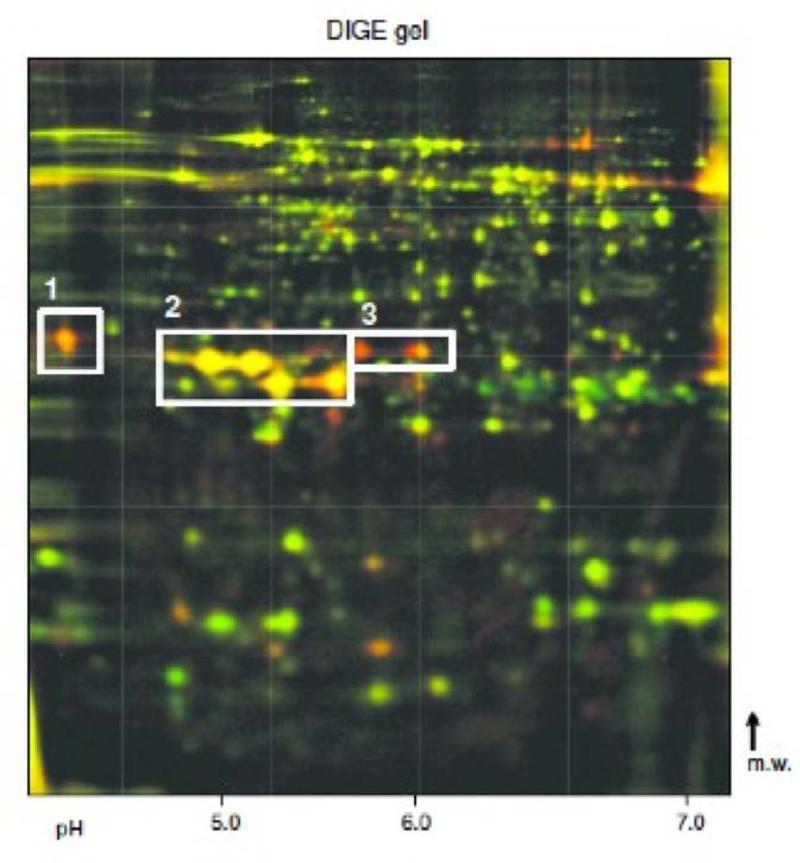
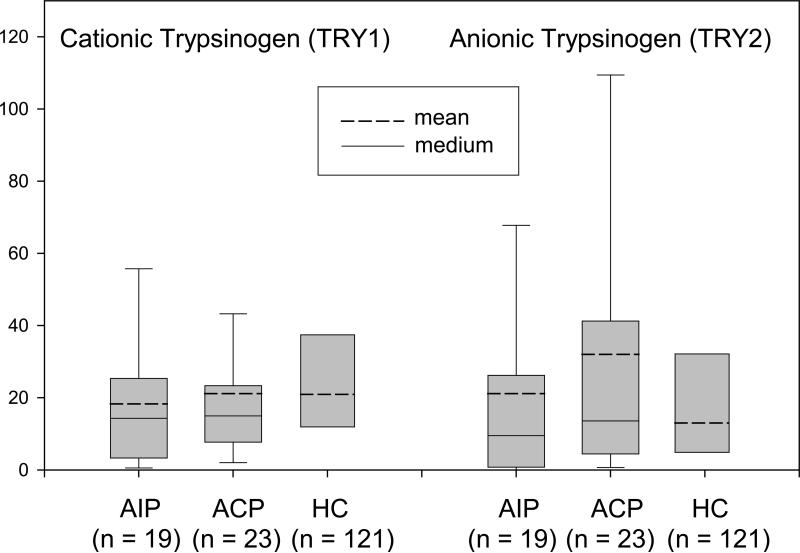
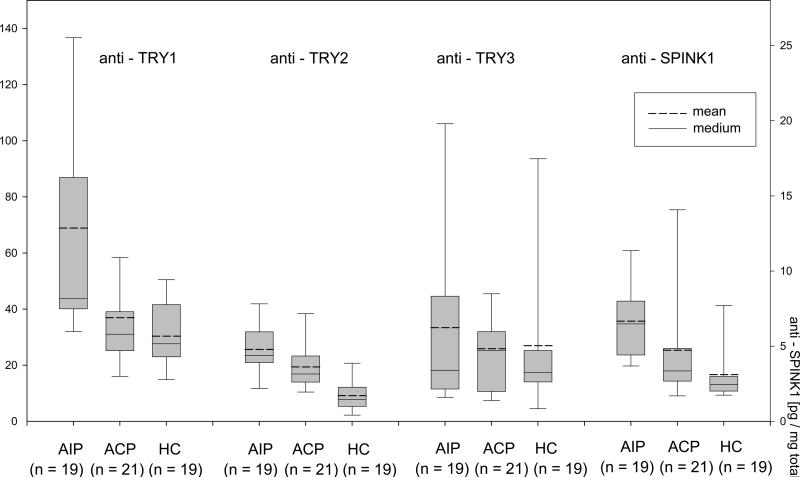
Results: Expression profiling showed 272 upregulated genes, including those encoding for immunoglobulins, chemokines and their receptors, and 86 downregulated genes, including those for pancreatic proteases such as three trypsinogen isoforms. Protein profiling showed that the expression of trypsinogens and other pancreatic enzymes was greatly reduced. Immunohistochemistry showed a near-loss of trypsin-positive acinar cells, which was also confirmed by western blotting. The serum of AIP patients contained high titers of autoantibodies against the trypsinogens PRSS1 and PRSS2 but not against PRSS3. In addition, there were autoantibodies against the trypsin inhibitor PSTI (the product of the SPINK1 gene). In the pancreas of AIP animals, we found similar protein patterns and a reduction in trypsinogen.

Conclusions: These data indicate that the immune-mediated process characterizing AIP involves pancreatic acinar cells and their secretory enzymes such as trypsin isoforms. Demonstration of trypsinogen autoantibodies may be helpful for the diagnosis of AIP.


Figures

Figure 1
Figure 1
(A) Immunostaining for trypsinogen revealed only individual positive cells in AIP in contrast to non-AIP CP (right upper frame). Insert: trypsinogen in normal pancreas. (B) Western blot for trypsinogen: lanes 1–2 normal pancreas, lanes 3–14 AIP, lanes 15–19 non-AIP CP. (C) Immunostaining for caspase-3 identified individual positive cells in AIP. Arrows indicate apoptotic acinar cells. Right lower frame: cytokeratin 8 staining demonstrating apoptosis in epithelial pancreatic cells. For details see methods.
Figure 1
Figure 1
(A) Immunostaining for trypsinogen revealed only individual positive cells in AIP in contrast to non-AIP CP (right upper frame). Insert: trypsinogen in normal pancreas. (B) Western blot for trypsinogen: lanes 1–2 normal pancreas, lanes 3–14 AIP, lanes 15–19 non-AIP CP. (C) Immunostaining for caspase-3 identified individual positive cells in AIP. Arrows indicate apoptotic acinar cells. Right lower frame: cytokeratin 8 staining demonstrating apoptosis in epithelial pancreatic cells. For details see methods.
Figure 2
Figure 2
(A) Two-dimensional hierarchical cluster analysis of AIP and non-AIP CP demonstrating a clear separation between the two varieties. Blue color refers to downregulation in AIP and red color to upregulation. Clustering of patients was based on 358 differentially-regulated genes (for details see methods). (B) Graph indicating functional relationships between differentially-regulated genes based on Gene Ontology annotations. Threshold is a GO depth of ≥8. Only the 79 genes that reached or exceeded the threshold are shown. Nodes represent genes and are labeled with the HUGO symbol. Edges show the connection between the two nodes that are compared. 26 different biological processes based on Gene Ontology terms are represented.
Figure 2
Figure 2
(A) Two-dimensional hierarchical cluster analysis of AIP and non-AIP CP demonstrating a clear separation between the two varieties. Blue color refers to downregulation in AIP and red color to upregulation. Clustering of patients was based on 358 differentially-regulated genes (for details see methods). (B) Graph indicating functional relationships between differentially-regulated genes based on Gene Ontology annotations. Threshold is a GO depth of ≥8. Only the 79 genes that reached or exceeded the threshold are shown. Nodes represent genes and are labeled with the HUGO symbol. Edges show the connection between the two nodes that are compared. 26 different biological processes based on Gene Ontology terms are represented.
Figure 3
Figure 3
Proteome analysis (A) Representative, silver-stained 2D gel electrophoresis gels of human pancreas (pH 4–7). The regions with major spot intensity changes are indicated: 1: anionic trypsinogen (PRSS2); 2: (pro)elastase 3B (ELA3B) & mesotrypsinogen (PRSS3); 3: cationic trypsinogen (PRSS1); 4: regenerating protein I. (B) Protein levels in the tissue of AIP patients, ACP patients and healthy controls. The boxes indicate the median/mean and 25th/75th percentiles. (C) Overlaid DIGE gel of murine pancreas; green channel: MAIDS infected mouse; red channel: healthy mouse. The spot regions with differentially-regulated proteases are indicated: 1: trypsinogen-20; 2: chymotrypsinogen B and trypsinogen-8; 3: (pro)elastase 3B.
Figure 3
Figure 3
Proteome analysis (A) Representative, silver-stained 2D gel electrophoresis gels of human pancreas (pH 4–7). The regions with major spot intensity changes are indicated: 1: anionic trypsinogen (PRSS2); 2: (pro)elastase 3B (ELA3B) & mesotrypsinogen (PRSS3); 3: cationic trypsinogen (PRSS1); 4: regenerating protein I. (B) Protein levels in the tissue of AIP patients, ACP patients and healthy controls. The boxes indicate the median/mean and 25th/75th percentiles. (C) Overlaid DIGE gel of murine pancreas; green channel: MAIDS infected mouse; red channel: healthy mouse. The spot regions with differentially-regulated proteases are indicated: 1: trypsinogen-20; 2: chymotrypsinogen B and trypsinogen-8; 3: (pro)elastase 3B.
Figure 4
Figure 4
Box plot chart of serum analysis. (A) Serum PRSS1 and PRSS2 were not significantly affected by pancreatitis. (B) Elevated serum levels of anti-PRSS1, anti-PRSS2 and anti-PSTI in AIP patients. The boxes indicate the median/mean and 25th/75th percentiles. Asterisks indicate a significant change in antibody level (p < 0.05)
Figure 4
Figure 4
Box plot chart of serum analysis. (A) Serum PRSS1 and PRSS2 were not significantly affected by pancreatitis. (B) Elevated serum levels of anti-PRSS1, anti-PRSS2 and anti-PSTI in AIP patients. The boxes indicate the median/mean and 25th/75th percentiles. Asterisks indicate a significant change in antibody level (p < 0.05)

Similar articles

Cited by

References

    1. Finkelberg DL, Sahani D, Deshpande V, et al. Autoimmune pancreatitis. N Engl J Med. 2006;355:2670–6. - PubMed
    1. Pickartz T, Mayerle J, Lerch MM. Autoimmune pancreatitis. Nat Clin Pract Gastroenterol Hepatol. 2007;4:314–23. - PubMed
    1. Gardner TB, Levy MJ, Takahashi N, et al. Misdiagnosis of autoimmune pancreatitis: a caution to clinicians. Am J Gastroenterol. 2009;104:1620–3. - PubMed
    1. Yoshida K, Toki F, Takeuchi T, et al. Chronic pancreatitis caused by an autoimmune abnormality. Proposal of the concept of autoimmune pancreatitis. Dig Dis Sci. 1995;40:1561–1568. - PubMed
    1. Zamboni G, Luttges J, Capelli P, et al. Histopathological features of diagnostic and clinical relevance in autoimmune pancreatitis: a study on 53 resection specimens and 9 biopsy specimens. Virchows Arch. 2004;445:552–63. - PubMed

Publication types

MeSH terms