Cytochrome-P450 2B1 gene silencing attenuates puromycin aminonucleoside-induced cytotoxicity in glomerular epithelial cells
- PMID: 20407477
- PMCID: PMC3053138
- DOI: 10.1038/ki.2010.100
Cytochrome-P450 2B1 gene silencing attenuates puromycin aminonucleoside-induced cytotoxicity in glomerular epithelial cells
Abstract
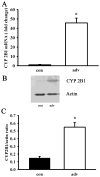
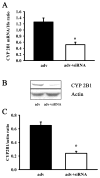
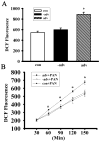
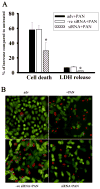
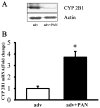
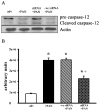
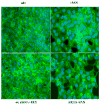
Previously, we demonstrated that cytochrome P450 2B1 (CYP2B1) can generate reactive oxygen species in puromycin aminonucleoside (PAN)-induced nephrotic syndrome, an animal model of minimal-change disease in humans. In this study we found that overexpression of CYP2B1 in rat glomerular epithelial cells in vitro significantly increased PAN-induced reactive oxygen species generation, cytotoxicity, cell death, and collapse of the actin cytoskeleton. All of these pathological changes were markedly attenuated by siRNA-induced CYP2B1 silencing. The cellular CYP2B1 protein content was significantly decreased whereas its mRNA level was markedly increased, suggesting regulation by protein degradation rather than transcriptional inhibition in the PAN-treated glomerular epithelial cells. This degradation of CYP2B1 was accompanied by the induction of heme oxygenase-1, an important indicator of heme-induced oxidative stress. In PAN-treated CYP2B1-silenced glomerular epithelial cells the induction of heme oxygenase-1 and caspase-3 activity were significantly decreased. Further, cleavage of the stress-induced pro-apoptotic endoplasmic reticulum-specific pro-caspase-12 was prevented in the silenced cells. Our results support a pivotal role of CYP2B1 for reactive oxygen species production in the endoplasmic reticulum in PAN-induced cytotoxicity.
Conflict of interest statement
All the authors declared no competing interests.
Figures



Similar articles
-
Cytochrome P450 2B1 mediates complement-dependent sublytic injury in a model of membranous nephropathy.J Biol Chem. 2010 Dec 24;285(52):40901-10. doi: 10.1074/jbc.M110.165498. Epub 2010 Oct 14. J Biol Chem. 2010. PMID: 20947506 Free PMC article.
-
Role of cytochrome P450 2B1 in puromycin aminonucleoside-induced cytotoxicity to glomerular epithelial cells.Nephron Exp Nephrol. 2003;94(1):e17-24. doi: 10.1159/000070815. Nephron Exp Nephrol. 2003. PMID: 12806184
-
Cytochrome P450 2B1 mediates oxidant injury in puromycin-induced nephrotic syndrome.Kidney Int. 2002 Sep;62(3):868-76. doi: 10.1046/j.1523-1755.2002.00515.x. Kidney Int. 2002. PMID: 12164868
-
Puromycin aminonucleoside induces glomerular epithelial cell apoptosis.Exp Mol Pathol. 2001 Feb;70(1):54-64. doi: 10.1006/exmp.2000.2345. Exp Mol Pathol. 2001. PMID: 11170791
-
Puromycin aminonucleoside induces apoptosis and increases HNE in cultured glomerular epithelial cells(1).Free Radic Biol Med. 2001 Sep 1;31(5):615-23. doi: 10.1016/s0891-5849(01)00641-4. Free Radic Biol Med. 2001. PMID: 11522446
Cited by
-
Oxidative Stress and Nutritional Antioxidants in Renal Diseases: A Narrative Review.Antioxidants (Basel). 2025 Jun 20;14(7):757. doi: 10.3390/antiox14070757. Antioxidants (Basel). 2025. PMID: 40722862 Free PMC article. Review.
-
Subacute nicotine co-exposure has no effect on 2,2',3,5',6- pentachlorobiphenyl disposition but alters hepatic cytochrome P450 expression in the male rat.Toxicology. 2015 Dec 2;338:59-68. doi: 10.1016/j.tox.2015.10.002. Epub 2015 Oct 14. Toxicology. 2015. PMID: 26463278 Free PMC article.
-
Cytochrome P450 2B1 mediates complement-dependent sublytic injury in a model of membranous nephropathy.J Biol Chem. 2010 Dec 24;285(52):40901-10. doi: 10.1074/jbc.M110.165498. Epub 2010 Oct 14. J Biol Chem. 2010. PMID: 20947506 Free PMC article.
-
Taurine Supplementation Alleviates Puromycin Aminonucleoside Damage by Modulating Endoplasmic Reticulum Stress and Mitochondrial-Related Apoptosis in Rat Kidney.Nutrients. 2018 May 29;10(6):689. doi: 10.3390/nu10060689. Nutrients. 2018. PMID: 29843457 Free PMC article.
-
Insulin-like growth factor 1 attenuates antiestrogen- and antiprogestin-induced apoptosis in ER+ breast cancer cells by MEK1 regulation of the BH3-only pro-apoptotic protein Bim.Breast Cancer Res. 2012 Mar 19;14(2):R52. doi: 10.1186/bcr3153. Breast Cancer Res. 2012. PMID: 22429491 Free PMC article.
References
-
- Ueda N, Baliga R, Shah SV. Role of ‘catalytic’ iron in an animal model of minimal change nephrotic syndrome. Kidney Int. 1996;49:370–373. - PubMed
-
- Gonick H. Current Nephrology. Mosby Year Book; Chicago: 1997.
-
- Nelson DR, Koymans L, Kamataki T, et al. P450 superfamily: update on new sequences, gene mapping, accession numbers and nomenclature. Pharmacogenetics. 1996;6:1–42. - PubMed
-
- Kuthan H, Tsuji H, Graf H, et al. Generation of superoxide anion as a source of hydrogen peroxide in a reconstituted monooxygenase system. FEBS Lett. 1978;91:343–345. - PubMed
-
- Ekstrom G, Ingelman-Sundberg M. Rat liver microsomal NADPH-supported oxidase activity and lipid peroxidation dependent on ethanol-inducible cytochrome P-450 (P-450IIE1) Biochem Pharmacol. 1989;38:1313–1319. - PubMed
Publication types
MeSH terms
Substances
Grants and funding
LinkOut - more resources
Full Text Sources
Research Materials

