. 2010 Mar 16:4:1.
doi: 10.3389/neuro.03.001.2010. eCollection 2010.

Odors Pulsed at Wing Beat Frequencies are Tracked by Primary Olfactory Networks and Enhance Odor Detection

Affiliations

Odors Pulsed at Wing Beat Frequencies are Tracked by Primary Olfactory Networks and Enhance Odor Detection

Shreejoy J Tripathy et al. Front Cell Neurosci. .

Abstract

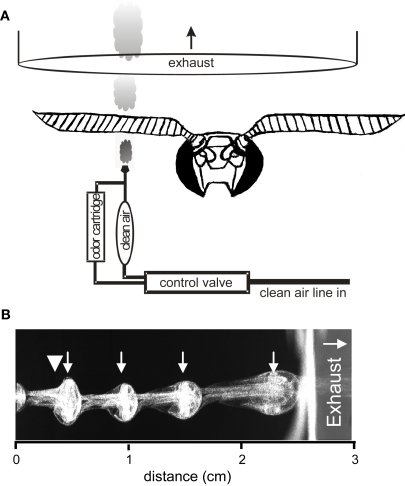
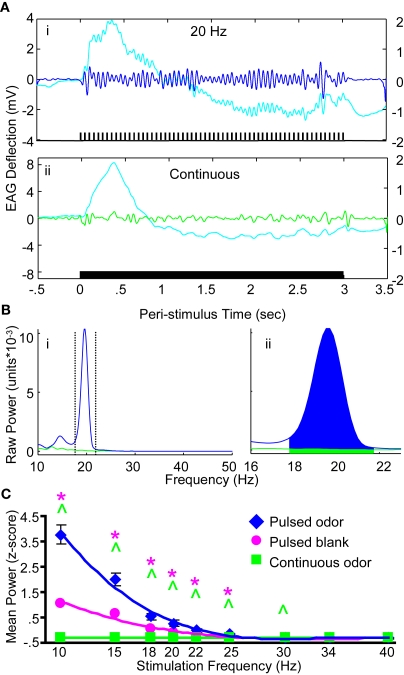
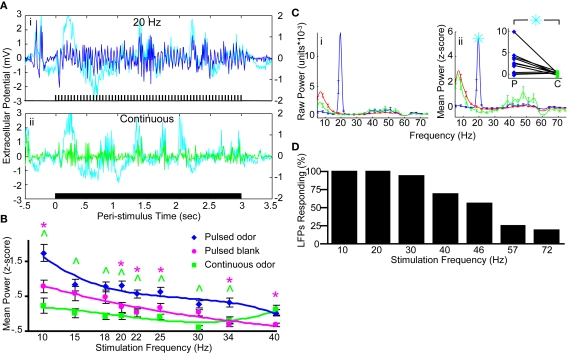
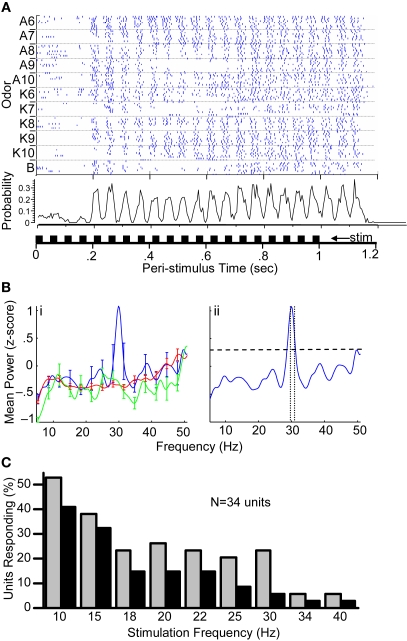
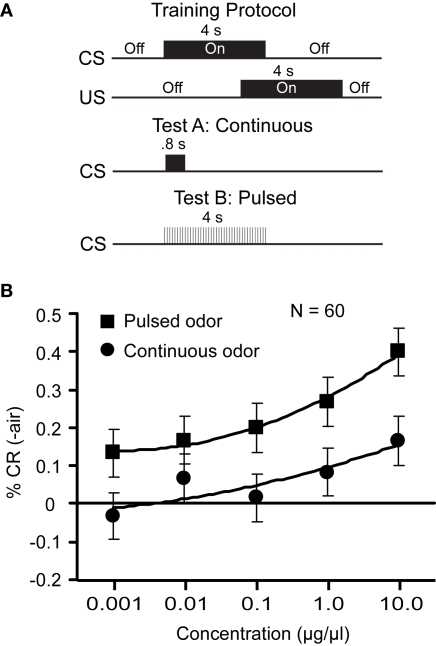
Each down stroke of an insect's wings accelerates axial airflow over the antennae. Modeling studies suggest that this can greatly enhance penetration of air and air-born odorants through the antennal sensilla thereby periodically increasing odorant-receptor interactions. Do these periodic changes result in entrainment of neural responses in the antenna and antennal lobe (AL)? Does this entrainment affect olfactory acuity? To address these questions, we monitored antennal and AL responses in the moth Manduca sexta while odorants were pulsed at frequencies from 10-72 Hz, encompassing the natural wingbeat frequency. Power spectral density (PSD) analysis was used to identify entrainment of neural activity. Statistical analysis of PSDs indicates that the antennal nerve tracked pulsed odor up to 30 Hz. Furthermore, at least 50% of AL local field potentials (LFPs) and between 7-25% of unitary spiking responses also tracked pulsed odor up to 30 Hz in a frequency-locked manner. Application of bicuculline (200 muM) abolished pulse tracking in both LFP and unitary responses suggesting that GABA(A) receptor activation is necessary for pulse tracking within the AL. Finally, psychophysical measures of odor detection establish that detection thresholds are lowered when odor is pulsed at 20 Hz. These results suggest that AL networks can respond to the oscillatory dynamics of stimuli such as those imposed by the wing beat in a manner analogous to mammalian sniffing.

Keywords: GABA; antennal lobe; olfaction; olfactory bulb; oscillations; sensory sampling; sniffing; synchrony.


Figures

Figure 1
Figure 1
Schematic of the general experimental setup in Experiments 1–3. (A) A single line feeds air into the valve and can be switched between the blank and the odor cartridges, which merge about 2 mm before the output nozzle. (B) High speed imaging of olfactometer output at 50 Hz with a velocity of 0.3 m/s and a 10:40-ms duty cycle. Titanium tetrachloride, which produces a neutrally buoyant condensate, was used to visualize this 50-Hz pulse train. The odor nozzle is just out of view to the left. The large arrowhead indicates where the antenna was placed during physiological experiments. Small inset arrows identify individual pulses. Because some titanium tetrachloride condenses at the tip of the nozzle, there is a constant stream even when the valve is not open. Note also that as individual pulses approach and pass through the opening of the exhaust (vertical white line) they are stretched indicating that the draw is faster than the puffing velocity.
Figure 2
Figure 2
Electroantennogram responses to pulsed odor. (A) Antennal nerve responses to periodic (i) versus continuous (ii) olfactory input. Stimulus representations are shown at the bottom of each panel. Unfiltered EAG voltage trace (cyan; left Y-axis) shows a slow wave response to both 20 Hz and continuous stimuli. High pass filtering (5 Hz) unmasks superimposed oscillations in the response to the pulsed, but not the continuous stimulus (blue/green; right Y-axis). (B) Power spectral density of pulsed (blue) and continuous (green) voltage traces show 20-Hz oscillations in the response to the pulsed stimulus. Dotted lines (i) highlight a 4-Hz region around the pulse stimulus frequency. (ii) This 4-Hz band around the input frequency was integrated to obtain total power value for both pulsed and continuous responses. Note that the pulsed area includes the continuous area as well. (C) Mean integrated EAG power as a function of frequency for pulsed odor (blue diamonds), pulsed blank (pink circles), and continuous odor stimulation (green squares). 3rd order trend lines are shown in the respective colors. Results are based on z-score normalized integrated power and error bars indicate SEM. At each frequency, significant differences between periodic responses of pulsed odor and pulsed blank are indicated by a pink asterisk; significant differences between pulsed odor and continuous odor responses are indicated by a green caret (both: t-test; p < 0.05).
Figure 3
Figure 3
Antennal lobe LFPs reflect periodic input. (A) Unfiltered LFPs traces (cyan) in response to a 20 Hz pulsed (i) or continuous (ii) stimulus. A stimulus representation is shown at the bottom of each panel. As with EAG responses, a pulsed input induces a periodic response that is unmasked by filtering (i, blue), which is not present when a continuous stimulus is used (ii, green). (B) Mean LFP power as a function of pulse frequency for pulsed odor (2-hexanone; blue), a pulsed blank (pink) and a continuous odor stimulus (green). Error bars indicate SEM. Significant differences between the pulsed odor and the blank or the continuous stimulus are denoted by an asterisk or caret, respectively (t-test; p < 0.05). (C) Raw (i) and z-score (ii) PSDs from a single LFP, averaged over all odor presentations of a single frequency (20 Hz) for pulsed (blue), continuous (green) stimulation, and spontaneous (red) activity. The cyan asterisk in (ii) indicates a peak in the PSD, which is significantly higher than the corresponding value elicited by continuous stimulation (p < 0.05). This PSD peak of the neural response is located at the same frequency that was used for pulsing the odor. Error bars indicate SEM and are shown in 3 Hz intervals. Inset in (ii) compares the normalized PSD values for all trials at the stimulation frequency of 20 Hz in response to pulsed (blue diamonds) or continuous (green squares) odor presentation. Lines connect stimulations of identical odors. X-axis indicates pulsed (P) or continuous (C). Asterisk is same asterisk in main figure. (D) Percentage of LFPs (16 total, 4 animals) that respond significantly to pulsing (p < 0.05) by stimulus frequency using the criteria shown in (C). The drop in number responding at 57 Hz may partially be due to the roll-off of the 60 Hz notch filter.
Figure 4
Figure 4
Single units are entrained by pulsed odor stimulation. (A) Peri-event raster (top) and histogram (bottom) of a single unit in response to 1-s long 20-Hz pulse trains. Each hashmark represents a single action potential. Black horizontal lines demark 10 repetitions each for a given odorant or a blank (listed on the y-axis; A = alcohol, K = ketone, and the associated number represents the number of carbon units on the side chain). Peri-stimulus histogram (bottom) is binned at 0.005 s. Y-axis indicates spike probability and X-axis indicates time in seconds and pulse timing (inset below). Data past 1.2 s post-stimulus are not shown because this unit was completely quiescent for ∼0.5 s after the response ended. (B) Methods for identification of pulse-tracking behavior of individual units. (i) Statistical method based on the comparison of mean PSDs in response to a pulsed (3 s at 30Hz; blue) or continuous (3 s; green) stimulus and for spontaneous activity (3 s; red). Error bars indicate SEM and are shown every 3 Hz. (ii). Highest peak criterion for identification of pulse-tracking units based on relative height of PSD peak around stimulus pulse frequency. Dotted lines +/−0.5 Hz around 30 Hz input frequency mark the frequency criterion for the peak. Dashed line marks the highest PSD value that is not at the pulsing frequency. Y-axis shown on left is the same for i and ii. (C) The percentage of responding units (34 total, 4 animals) by frequency. Grey bars indicate count using highest peak criteria (cf. 4Bii) and black bars indicate count using statistical criteria (cf. 4Bi).
Figure 5
Figure 5
The specific GABAA antagonist BMI affects LFP and single unit responses to pulsed stimuli. (A) Spectrogram of LFP before (i) and during (ii) BMI bath application (200 μM) in response to a 1 s 20 Hz pulse train with 1-hexanol. Average values are based on 10 (i) and 5 (ii) repetitions from the same animal. Color bar on right and x-axis indicates values for both graphs. The strong power band around 20 Hz (i) is completely abolished by BMI (ii). (B) Mean integrated LFP power pre- (dark grey bars) and post- (white bars) BMI application. Stimulation frequencies are indicated on the x-axis. Results based on z-score normalization performed within each stimulation frequency and each animal. Asterisks indicate statistically significant differences in power for comparisons of pre- versus post-BMI application (t-test, p < 0.05). Note values for pre-BMI are significantly larger than post-BMI at all frequencies. (C) Raster and histogram for a single unit in response to five 1-s long 20-Hz pulse trains using 6–10 carbon ketones before (i) and during (ii) BMI bath application. Histogram binned at 0.005 s. (D) Percentage of single units responding to pulsed odor presentations before and after BMI superfusion (35 total units, 3 animals) based on the statistical (black) and highest peak criterion (grey). For both conditions, white bars indicate the respective percentage of units that continued to pulse track during BMI application.
Figure 6
Figure 6
Pulsing odor lowers detection thresholds. (A) Schematic of training and testing protocols for assessing detection thresholds. Animals were trained to respond to an odor presented continuously for 4-s using sucrose as a US. Acquisition of the CR was assessed using both test stimuli: either A on the first and B on the second day or vice versa. Test A was a 0.8-s continuous odor stimulus and Test B a 4-s stimulus pulsed at 20 Hz with a 10:40 ms on:off duty cycle. Stimulus durations and duty cycles adjusted so that the total odor delivered for Test A was identical to Test B. (B) Mean conditioned response as a function of concentration of pulsed stimulation (squares) or continuous stimulation (circles). Error bars indicate standard error. Responses elicited by pulsed or continuous blank stimuli were subtracted from response measures for each concentration. Therefore, the percent response for the lowest concentration for the continuous stimulus is below 0.

Similar articles

Cited by

References

    1. Adrian E. D. (1942). Olfactory reactions in the brain of the hedgehog. J. Physiol. (Lond.) 100, 459–473 - PMC - PubMed
    1. Anton S., Hansson B. S. (1994). Central processing of sex-pheromone, host odor, and oviposition deterrent information by interneurons in the antennal lobe of female Spodoptera littoralis (Lepidoptera, Noctuidae). J. Comp. Neurol. 350, 199–21410.1002/cne.903500205 - DOI - PubMed
    1. Barrozo R. B., Kaissling K. E. (2002). Repetitive stimulation of olfactory receptor cells in female silkmoths Bombyx mori L. J. Insect Physiol. 48, 825–83410.1016/S0022-1910(02)00109-9 - DOI - PubMed
    1. Bau J., Justus K. A., Carde R. T. (2002). Antennal resolution of pulsed pheromone plumes in three moth species. J. Insect Physiol. 48, 433–44210.1016/S0022-1910(02)00062-8 - DOI - PubMed
    1. Bau J., Justus K. A., Loudon C., Carde R. T. (2005). Electroantennographic resolution of pulsed pheromone plumes in two species of moths with bipectinate antennae. Chem. Senses 30, 771–78010.1093/chemse/bji069 - DOI - PubMed

LinkOut - more resources