. 2010 Mar 31:4:9.
doi: 10.3389/fncel.2010.00009. eCollection 2010.

Inhibitory "noise"

Affiliations

Inhibitory "noise"

Alain Destexhe. Front Cell Neurosci. .

Abstract

Cortical neurons in vivo may operate in high-conductance states, in which the major part of the neuron's input conductance is due to synaptic activity, sometimes several-fold larger than the resting conductance. We examine here the contribution of inhibition in such high-conductance states. At the level of the absolute conductance values, several studies have shown that cortical neurons in vivo are characterized by strong inhibitory conductances. However, conductances are balanced and spiking activity is mostly determined by fluctuations, but not much is known about excitatory and inhibitory contributions to these fluctuations. Models and dynamic-clamp experiments show that, during high-conductance states, spikes are mainly determined by fluctuations of inhibition, or by inhibitory "noise". This stands in contrast to low-conductance states, in which excitatory conductances determine spiking activity. To determine these contributions from experimental data, maximum likelihood methods can be designed and applied to intracellular recordings in vivo. Such methods indicate that action potentials are indeed mostly correlated with inhibitory fluctuations in awake animals. These results argue for a determinant role for inhibitory fluctuations in evoking spikes, and do not support feed-forward modes of processing, for which opposite patterns are predicted.

Keywords: cerebral cortex; computational models; conductance; dynamic-clamp; spike-triggered average.


Figures
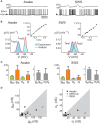
Figure 1
Figure 1
VmD estimation of conductances from intracellular recordings in awake and naturally sleeping cats. (A) Intracellular recordings in awake and naturally sleeping (SWS) cats. Recordings were made in association cortex (area 5–7). (B) Examples of Vm distributions computed during wakefulness (Awake) and slow-wave sleep up-states (SWS). The continuous lines show Gaussian fits of the experimental distributions. Insets: current–voltage relations obtained for these particular neurons. (C) Conductance values estimated using the VmD method. Results for the means (ge0, gi0) and standard deviations (σe, σi) of excitatory and inhibitory conductances, respectively, as well as their ratios are shown (error bars: standard deviations obtained by repeating the analysis using different pairs of injected current levels). (D) Grouped data showing the means and standard deviations of the conductances for different cells across different behavioral states (REM = Rapid Eye Movement sleep). Figure modified from Rudolph et al. (2007).
Figure 2
Figure 2
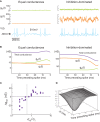
Comparison between equal conductances and inhibition-dominated regimes in models and dynamic-clamp experiments. (A) Model with equal conductance (left; ge0 = gi0 = 10 nS, σe = σi = 2.5 nS) and inhibition-dominated states (right; ge0 = 25 nS, gi0 = 100 nS, σe = 7 nS and σi = 28 nS). Excitatory and inhibitory conductances, and the membrane potential, are shown from top to bottom. Action potentials (truncated here) were described by Hodgkin–Huxley type models (Destexhe et al., 2001). (B) Average conductance patterns triggering spikes in the model. Spike-triggered averages (STAs) of excitatory, inhibitory and total conductance were computed in a window of 50 ms before the spike. (C) Geometrical prediction tested in dynamic-clamp: grouped data showing the total conductance change preceding spikes as a function of the ratio σei. The dashed line (σei = 0.6) visualizes the predicted value separating total conductance increase cases from total conductance decrease cases. (D) Spike-triggered covariance analysis. The covariance between ge and gi (with delay Δt) is represented as a function of the time preceding spike in a dynamic-clamp experiment with inhibition-dominated state. (A–C) Modified from Piwkowska et al. (2008), (D) unpublished.
Figure 3
Figure 3
Spike-triggered conductance analysis in vivo. (A) STA conductance analysis from intracellular recordings in awake and sleeping cats. Two example cells are shown during wakefulness, and for each, the Vm STA (top) and the extracted conductance STAs (bottom) are shown. In the first cell (left), the total conductance increases before the spike. In the second example cell (right), the total conductance decreases before the spike (black traces are exponential fits to the extracted STAs). This cell represents the majority of the cases. (B) Relation between total membrane conductance change before the spike, (Δge − Δgi)/(ge0 + gi0) (“relative conductance change”), and the difference of excitatory and inhibitory conductance, (ge0 − Δgi0)/(ge0 + gi0) (“relative excess conductance”), estimated using the VmD method. Most cells are situated in the lower-left quadrant (gray), indicating a relation between inhibitory-dominant states and a drop of membrane conductance prior to the spike. (C) Relation between relative conductance change before the spike and conductance fluctuations, expressed as the difference between excitatory and inhibitory fluctuations, (σe − σi)/(ge0 + gi0) (“relative excess conductance fluctuations”). Here, a clear correlation (gray area) shows that the magnitude of the conductance change before the spike is related to the amplitude of conductance fluctuations. Symbols: wake = open circles, SWS-Up = gray circles, REM = black circles. (D) Total conductance change preceding spikes as a function of the ratio σei. Given the cell-to-cell variability of observed spike thresholds, each cell has a different predicted ratio separating total conductance increase cases from total conductance decrease cases. The two dashed lines (σei = 0.48 and σei = 1.07) visualize the two extreme predicted ratios. Cells in white are the ones not conforming to the prediction. (A–C) Modified from Rudolph et al. (2007); (D) modified from Piwkowska et al. (2008).

References

    1. Anderson J. S., Carandini M., Ferster D. (2000). Orientation tuning of input conductance, excitation, and inhibition in cat primary visual cortex. J. Neurophysiol. 84, 909–926 - PubMed
    1. Baranyi A., Szente M. B., Woody C. D. (1993). Electrophysiological characterization of different types of neurons recorded in vivo in the motor cortex of the cat. II. Membrane parameters, action potentials, current-induced voltage responses and electrotonic structures. J. Neurophysiol. 69, 1865–1879 - PubMed
    1. Borg-Graham L. J., Monier C., Frégnac Y. (1998). Visual input evokes transient and strong shunting inhibition in visual cortical neurons. Nature 393, 369–37310.1038/30735 - DOI - PubMed
    1. Brunel N. (2000). Dynamics of sparsely connected networks of excitatory and inhibitory spiking neurons. J. Comput. Neurosci. 8, 183–20810.1023/A:1008925309027 - DOI - PubMed
    1. Destexhe A. (2007). High-Conductance State. Scholarpedia 2: 1341 Available at: http://www.scholarpedia.org/article/High-Conductance_State

LinkOut - more resources