. 2010 Apr 15:6:215-28.
doi: 10.2147/vhrm.s9472.

Blood flow interplays with elastin: collagen and MMP: TIMP ratios to maintain healthy vascular structure and function

Affiliations

Blood flow interplays with elastin: collagen and MMP: TIMP ratios to maintain healthy vascular structure and function

Poulami Basu et al. Vasc Health Risk Manag. .

Abstract

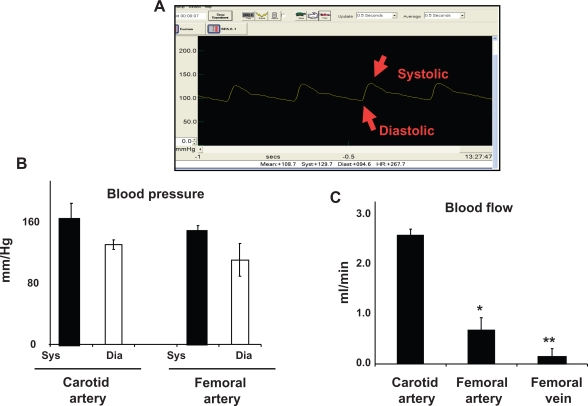
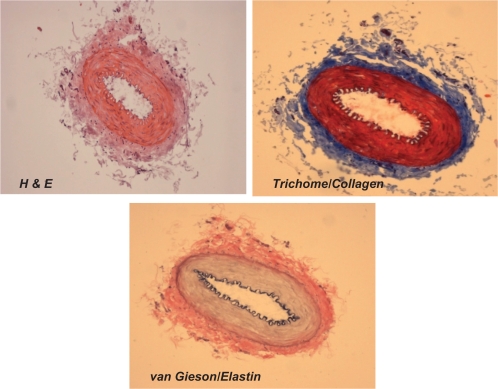
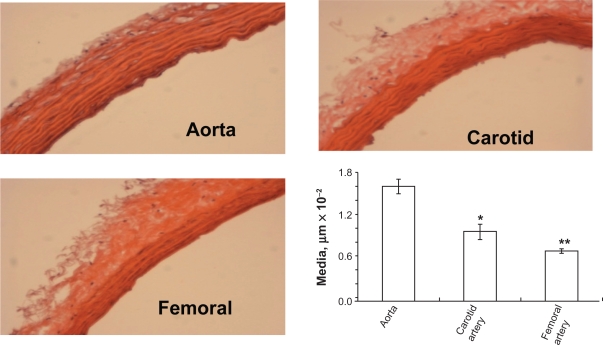
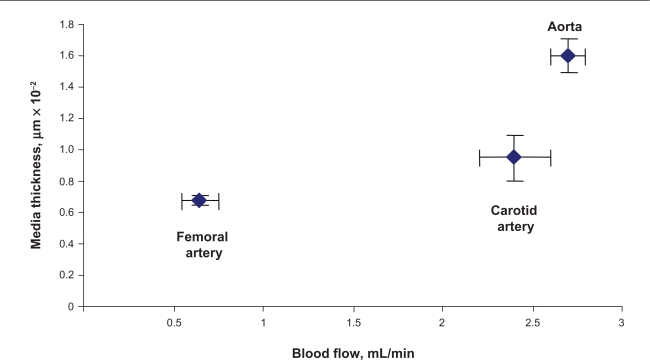
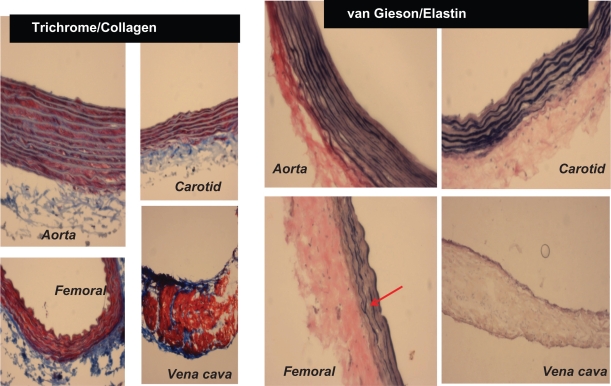
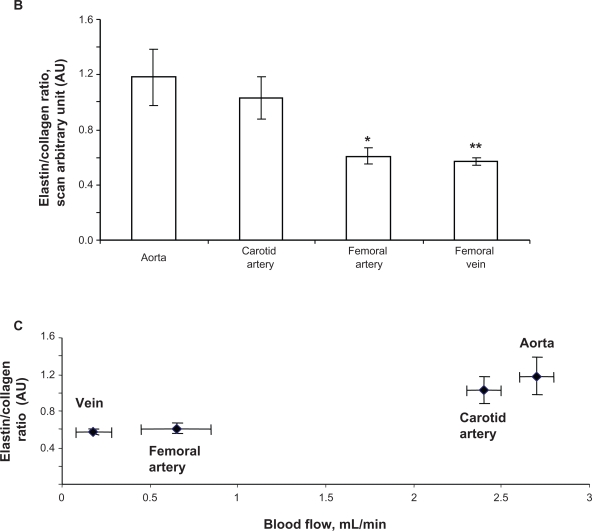
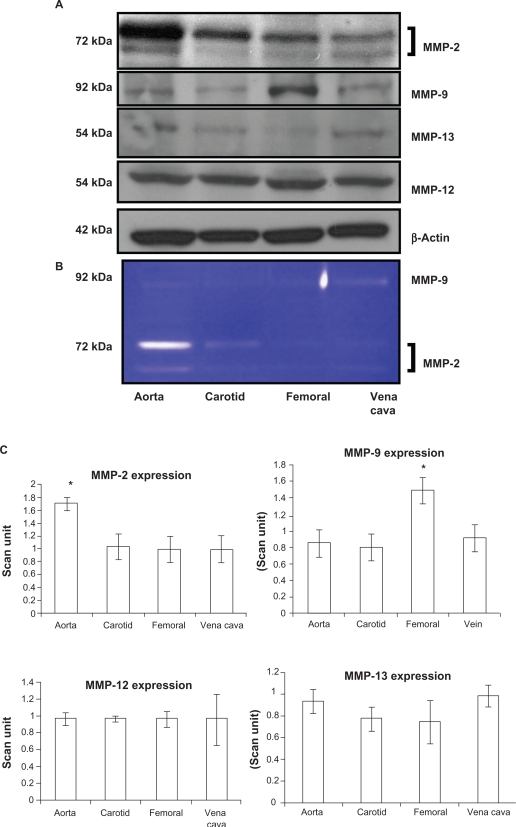
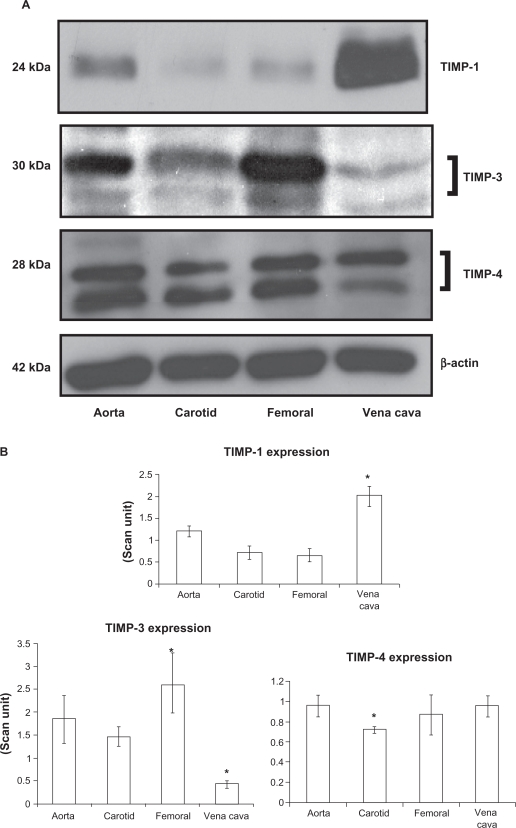
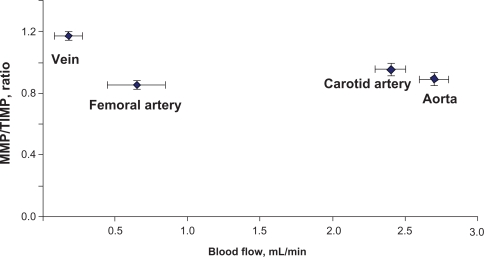
Differential vascular remodeling is one of the major mechanisms of heterogeneity in atherosclerosis. The structural and functional heterogeneity between arteries and veins determines the degree of vascular remodeling. Matrix metalloproteases (MMPs) and their tissue inhibitors (TIMPs) play key roles in vascular structural and functional remodeling. We hypothesized that the level of blood flow in different arteries and veins caused structural and functional heterogeneity that ultimately determined potential vascular remodeling. To test this hypothesis, in vivo blood flow and blood pressure in the aorta, carotid, femoral artery, and femoral vein was measured in male Sprague-Dawley rats (weight 380-400 gm). Arterial and venous pressures were measured by PE-50 catheter cannulation. Blood flow was measured by a transonic ultrasound system. The aortic arch, femoral and carotid arteries, and abdominal vena cava were isolated to determine the expression of MMP-2, -9, -12, and -13 and TIMP-1, -3, and -4 by Western blot and in gelatin gel zymography. Masson trichrome and van Gieson stains were used to stain the histologic tissue sections. The results revealed that blood flow was higher in the aorta and carotid artery than the femoral artery and vein. MMP-9 and MMP-13 were higher in the carotid artery in comparison with the other blood vessels, while TIMP-3 showed higher expression in the aorta than the arteries. Further, the MMP-9 activity was significantly higher in the carotid artery than in the aorta and femoral artery. There was a higher degree of basement membrane collagen in the femoral artery and therefore a low elastin: collagen ratio, while in the carotid artery a higher level of elastin and, therefore, a high elastin: collagen ratio was found. The results suggested that medial thickness and elastin:collagen ratios had a threshold in blood flow in the range 0.6-2.5 mL/min, which increased robustly if blood flow increased to 2.7 mL/min. This pattern was inverted by the total MMP:TIMP ratio. We conclude that vascular remodeling is a function of rate of blood flow, which would in turn be determined by the amounts of MMPs and their inhibitors present. The study combined the endothelial and dynamic (blood flow/pressure) components that affect medial thickness and elastin: collagen ratios.

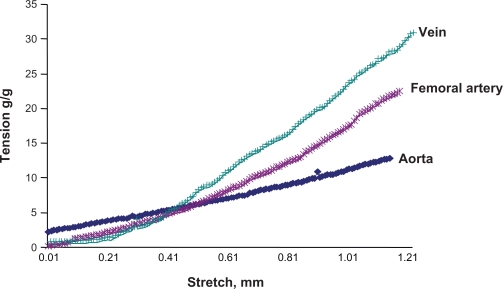
Keywords: atherosclerosis; passive stretch-tension relationship; vascular remodeling.


Figures

Figure 1
Figure 1
Arterial blood pressure and blood flow. A) A typical femoral arterial wave showing systolic and diastolic peaks. A PE-50 catheter was inserted into femoral artery. B) Bar graphs showed the systolic (sys) and diastolic (dia) blood pressure, measured in the carotid and femoral arteries. C) Bar graphs showed blood flow in different vascular beds. Notes: Data represents mean ± SE, n = 5. * and ** indicate P < 0.05 versus carotid artery.
Figure 2A
Figure 2A
Different staining of femoral artery. Hematoxylin and eosin (H and E) staining was used to determine the general morphology of the blood vessels; the pinkish part represents the cytoplasm and the blue spots show the presence of nucleus in the artery wall. Masson trichrome staining was used for determination of collagen in tissue; the blue staining at the tunica adventitia represents the presence of collagen in the blood vessel; van Gieson staining was used to determine the presence of elastin in tissues; the blackish-brown staining in the tunica intima shows the presence of elastin in the artery.
Figure 2B
Figure 2B
Hematoxylin and eosin staining of different arteries. H and E staining of different arteries was done to determine the structural differences between the arteries. The aorta showed the highest medial thickness and the femoral artery showed lowest medial thickness when compared with the other two arteries. The bar graphs represent the differential medial thickness of the arteries. Notes: Data represent mean ± SE, n = 5; * and ** indicates P < 0.05 versus aorta.
Figure 2C
Figure 2C
Correlation between medial thickness and blood flow. Aorta has highest medial thickness and highest blood flow compared with the other two vessels. Note: Data represent ± SE, n = 5.
Figure 3 A
Figure 3 A
Masson trichrome blue staining. The blue color represents collagen. The aorta and carotid artery showed minimum levels of collagen expression, whereas a higher level of collagen was present in the femoral artery and in the vena cava. Van Gieson staining was used to stain different blood vessels to determine the presence of elastin, which is represented by the blackish-brown color. The aorta and carotid artery showed higher levels of elastin in comparison with the femoral artery and the vena cava. The red arrow indicates the broken structure of the elastin tissue; the underlying cause of this could be the higher level of expression of the MMP-9 protein (an elastinase) in the femoral artery in comparison with the other blood vessels.
Figure 3 B
Figure 3 B
Elastin:collagen ratio. C) Blood flow in relation to elastin:collagen ratio. Data show the femoral artery and vein has a low elastin:collagen ratio when compared with the other blood vessels, and the elastin:collagen ratio increases with increase in blood flow. Notes: Data represent mean ± SE, n = 5; * and ** indicates P < 0.05 versus aorta.
Figure 4
Figure 4
Differential expression A) activity B) and C) bar graphs of scanned intensity values of MMPs in different vascular beds. Western blot was performed to detect the MMP protein. The MMP-2 protein is expressed in a higher level in the aorta, whereas the MMP-9 protein is expressed in higher levels in the femoral artery, and the MMP-12 and MMP-13 protein not show any significant difference when compared with the other blood vessels. Notes: Data represent mean ± SE, n = 5; * indicates P < 0.05 versus aorta or femoral artery, respectively.
Figure 5
Figure 5
Differential expression of TIMPs in vascular beds. A) Western blot analysis. B) Bar graphs of scanned intensity values. The TIMP-1 protein was detected at higher levels in the vena cava, whereas TIMP-3 was found at lower levels compared with other vessels. TIMP-4 was detected at lower levels in the carotid artery. The bar diagram shows densitometric analyses of TIMP protein. Notes: Data represent mean ± SE, n = 5; * indicates P < 0.05 vs. aorta.
Figure 5 C
Figure 5 C
Relationship between MMP:TIMP ratio and the blood flow. In order to get the MMP:TIMP ratio, averaged scanned data of MMPs in each of the blood vessels was calculated and divided by the averaged scanned units of TIMPs from the blood vessel. MMP:TIMP ratio was plotted in the y axis and the blood flow was plotted in the x axis. The vena cava has the highest MMP:TIMP ratio and the lowest blood flow in comparison with the other blood vessels.
Figure 6
Figure 6
Passive stretch-tension relationship between different vascular beds. A stretch-tension relationship was obtained by increasing the stretch 0.001 mm at a time. The resulting tension was plotted in the y axis, and the stretch was plotted in the x axis. The vena cava showed the maximum response to the stretch, because this blood vessel has the minimum elastin and maximum amount of collagen, whereas the aorta showed the minimum response to that, because this blood vessel has the maximum amount of elastin and minimum amount of collagen among the studied arteries.

Similar articles

Cited by

References

    1. Greenwald SE. Ageing of the conduit arteries. J Pathol. 2007;211(2):157–172. - PubMed
    1. Milewicz DM, Urban Z, Boyd C. Genetic disorders of the elastic fiber system. Matrix Biol. 2000;19(6):471–480. - PubMed
    1. Davies PF. Flow-mediated endothelial mechanotransduction. Physiol Rev. 1995;75(3):519–560. - PMC - PubMed
    1. Apter JT. Correlation of visco-elastic properties with microscopic structure of large arteries. IV. Thermal responses of collagen, elastin, smooth muscle, and intact arteries. Circ Res. 1996;21(6):901–918. - PubMed
    1. Harkness ML, Harkness RD, McDonald DA. The collagen and elastin content of the arterial wall in the dog. Proc R Soc Lond B Biol Sci. 1957;146(925):541–551. - PubMed

Publication types

Substances