. 2010 Mar 22:4:8.
doi: 10.3389/fncir.2010.00008. eCollection 2010.

Cholinergic neuromodulation controls directed temporal communication in neocortex in vitro

Affiliations

Cholinergic neuromodulation controls directed temporal communication in neocortex in vitro

Anita K Roopun et al. Front Neural Circuits. .

Abstract

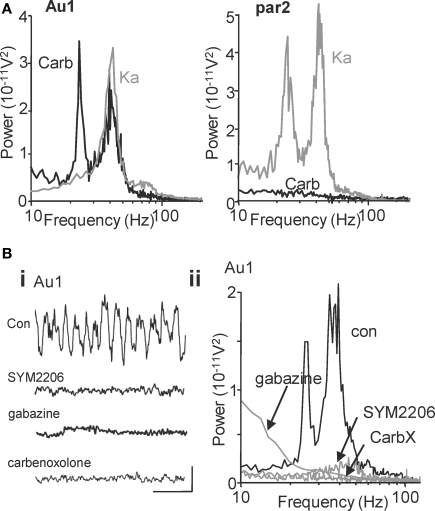
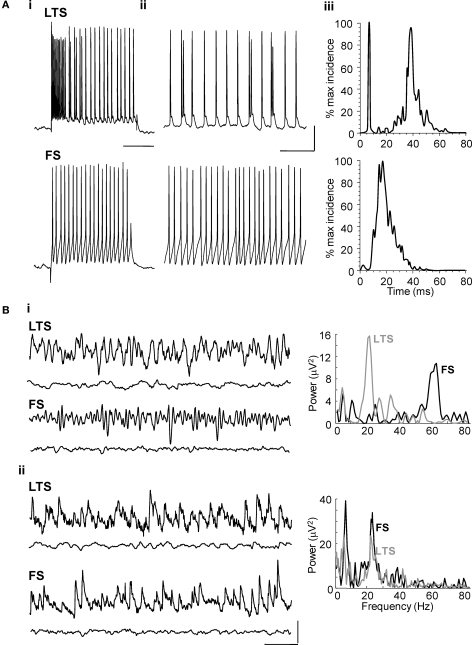
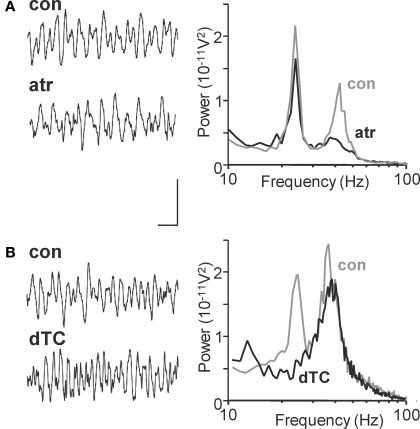
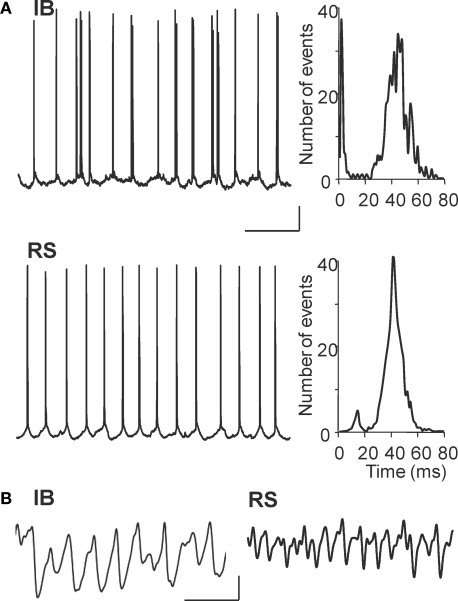
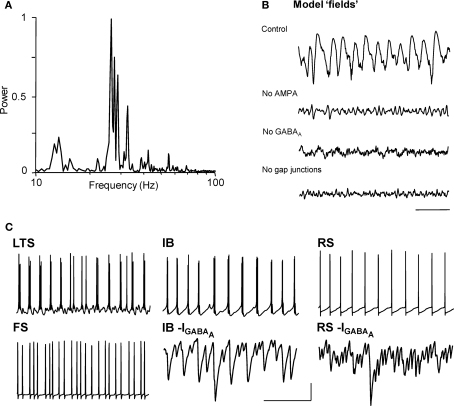
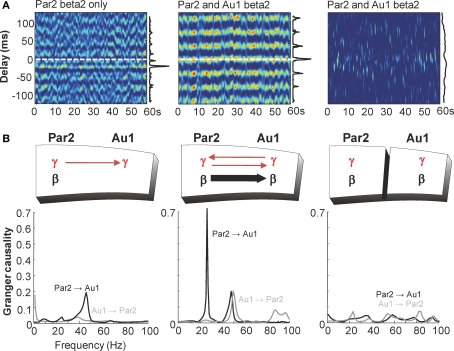
Acetylcholine is the primary neuromodulator involved in cortical arousal in mammals. Cholinergic modulation is involved in conscious awareness, memory formation and attention - processes that involve intercommunication between different cortical regions. Such communication is achieved in part through temporal structuring of neuronal activity by population rhythms, particularly in the beta and gamma frequency ranges (12-80 Hz). Here we demonstrate, using in vitro and in silico models, that spectrally identical patterns of beta2 and gamma rhythms are generated in primary sensory areas and polymodal association areas by fundamentally different local circuit mechanisms: Glutamatergic excitation induced beta2 frequency population rhythms only in layer 5 association cortex whereas cholinergic neuromodulation induced this rhythm only in layer 5 primary sensory cortex. This region-specific sensitivity of local circuits to cholinergic modulation allowed for control of the extent of cortical temporal interactions. Furthermore, the contrasting mechanisms underlying these beta2 rhythms produced a high degree of directionality, favouring an influence of association cortex over primary auditory cortex.

Keywords: EEG; attention; auditory; coherence; interneuron; oscillation.


Figures

Figure 1
Figure 1
Cholinergic neuromodulation generates beta2 and gamma oscillations in primary auditory cortex: Spectral but not mechanistic similarity to glutamatergic rhythms in association cortex. (A) Power spectra of local field potential activity in layer IV of primary auditory cortex (Au1) induced by cholinergic neuromodulation (carb, black line) or glutamatergic excitation (Ka, grey line). Layer IV recordings reveal field potential activity originating in both adjacent superficial (layer III) and deep (layer V) layers and thus permit direct visual comparison (e.g. Roopun et al., 2006). Note both manipulations generate gamma rhythms but only cholinergic modulation induces a beta rhythm. In contrast, power spectra of local field potential activity in layer IV of association cortex (par2, right graph) show no rhythm generation by cholinergic modulation (carb, black line), but a spectrally similar pattern of gamma and beta2 rhythms induced by glutamatergic excitation (Ka, grey line). (B) Auditory cortical beta rhythms depend on excitatory and inhibitory synaptic activity in contrast to those seen in par2 (Roopun et al., 2006). (Bi) Five-hundred milliseconds traces showing extracellular activity in the presence of carbachol. Scale bars: 100 μV, 100 ms. (Bii) Power spectra of activity from layer IV in the 1° auditory cortex after carbachol (15 μM) application (black trace) and after 60 min of SYM2206 (25 μM) application (grey line, top graph), gabazine application (500 nM, grey line, middle graph) and carbenoxolone (100 μM, grey line bottom graph).
Figure 2
Figure 2
Layer V LTS interneuron – but not FS interneuron – outputs are at beta frequency during cholinergically driven Au1 rhythms. (A) Intracellular recordings from layer IV/V interneurons in the primary auditory cortex. (Ai) Current steps of 0.2 nA characterised the layer V cells as LTS or FS interneurons in experiment. (Aii) The firing rate of an LTS cell and an FS cell at resting membrane potential (RMP = −62 and −56 mV, respectively) during carbachol-induced oscillations. (Aiii) Corresponding spike-frequency histograms from 60 s epochs of activity in each cell type. Note only LTS cells generate outputs at beta frequency. Scale bar for current step: 10 mV, for on-going spike generation 15 mV, 100 ms. (B) Excitatory and inhibitory synaptic inputs to LTS and FS interneurons in layer V. (Bi) Example traces showing inhibitory postsynaptic potentials at −30 mV membrane potential in LTS and FS cells (upper traces) during cholinergic beta rhythms in Au1. Inhibitory inputs match, in frequency, the different outputs from these two cell types as shown by the inter-event time histograms on the right. Lower traces show behaviour of each cell type in the presence of gabazine (500 nM). (Bii) Example traces showing excitatory synaptic inputs to an LTS and FS interneuron during population beta rhythm (upper traces). Both neuron subtypes receive compound EPSPs at the population beta frequency. Lower traces show behaviour of each cell type in the presence of SYM2206 (25 μM). Scale bars 2 mV, 100 ms.
Figure 3
Figure 3
Nicotinic and muscarinic cholinoceptors differentiate between layer II/III gamma and layer 5 beta2 cholinergic rhythms in Au1. (A) Example traces of field potential activity from layer IV in the 1° auditory cortex after carbachol (15 μM) application (con) and subsequent atropine (100 nM) application (atr). Spectra on the right show pooled frequency content from n = 5 experiments showing selective blockade of gamma rhythms with muscarinic receptor blockade (black trace). (B) Corresponding 500 ms recordings of layer IV extracellular activity in the presence of carbachol (con) and after application of d-Tubocurarine (10 μM, dTC). Spectra show pooled activity from n = 5 60 s epochs of field recording illustrating the selective blockade of beta rhythms with nicotinic receptor antagonism. Scale bar for traces = 100 μV, 100 ms.
Figure 4
Figure 4
Cholinergic neuromodulation generates beta frequency outputs from layer V principal cells in Au1. (A) Example intracellular recordings from a layer V IB cell and RS cell at rmp during carbachol-induced beta2 oscillations in the 1° auditory cortex. Corresponding event histograms on the right show interspike intervals for both cells correspond to the population beta2 rhythm in experiment. (B) Example recordings from IB and RS cells at −30 mV membrane potential. Both cell types demonstrate prominent beta2 frequency inhibitory postsynaptic potentials, though the higher gamma frequency activity is also evident in RS cells. Scale bars 100 ms, 20 mV (A), 100 ms, 5 mV/5 nS (B).
Figure 5
Figure 5
Model predicts synaptic connectivity between layer V pyramidal cells and gap junctionally coupled LTS cells is necessary and sufficient for cholinergic beta2 rhythm generation. (A) Model ‘field’ potential (mean synaptic activity) spectrum from excited, interconnected IB, RS, FS and LTS cell network shows a prominent beta2 frequency peak. (B) The pharmacology of model beta2 rhythms is the same as that in experiment (cf. Figure 1). Scale bar 100 ms. Note gap junctions are only present in the model between LTS interneurons. (C) The model reproduces the pattern of pyramidal cell inhibitory inputs (GABAA receptor-mediated postsynaptic currents, shown inverted) and spike outputs faithfully and demonstrates that only LTS interneurons, and not FS interneurons, generate a beta2 frequency output. Scale bars 20 mV (somatic membrane potential traces), 5 nS (synaptic currents), 100 ms.
Figure 6
Figure 6
Cholinergic neuromodulation is essential for Au1-par2 coherence at beta2 frequencies. (A) Windowed cross correlograms of 60 s epochs of field potential recordings from layer 5 of association cortex (par2) and primary auditory cortex (Au1) in conditions where beta2 rhythms are generated only in par2 (kainate bath application), and present in both par2 and Au1 (kainate and carbachol bath application) in intact slice and with full-thickness cut between par2 and Au1. Vertical graphs along side show pooled histograms of phase relationship measured as the position of the peak in each cross correlation window. Note the peak phase relationship corresponds to gamma frequencies with par2 beta alone and beta frequency when both areas generate this rhythm. Separation of areas abolishes phase relationships (B). Granger causality estimates for concurrent field potentials in LIV par2 and Au1 in conditions where both areas generate gamma rhythms but only par2 generates beta rhythms (kainate bath application). The lack of influence of Au1 on par2 (grey line) contrasts with influence of par2 on Au1 at gamma frequencies (black line). Middle graph shows Granger causality estimates for concurrent field potentials in LIV par2 and Au1 in conditions where Au1 and par2 generate both beta2 and gamma rhythms (kainate and carbachol bath application). Interactions at gamma frequencies become bidirectional and par2 now Granger-causes beta2 rhythms in Au1 (black line). These directed interactions are absent when par2 and Au1 are physically separated (right graph).

Similar articles

Cited by

References

    1. Baker S. N. (2007). Oscillatory interactions between sensorimotor cortex and the periphery. Curr. Opin. Neurobiol. 17, 649–65510.1016/j.conb.2008.01.007 - DOI - PMC - PubMed
    1. Beierlein M., Gibson J. R., Connors B. W. (2000). A network of electrically coupled interneurons drives synchronised inhibition in neocortex. Nat. Neurosci. 3, 904–91010.1038/78809 - DOI - PubMed
    1. Beierlein M., Gibson J. R., Connors B. W. (2003). Two dynamically distinct inhibitory networks in layer 4 of the neocortex. J. Neurophysiol. 90, 2987–300010.1152/jn.00283.2003 - DOI - PubMed
    1. Cui J., Xu L., Bressler S. L., Ding M., Liang H. (2008). BSMART: a matlab/C toolbox for analysis of multichannel neural timeseries. Neural. Netw. 21, 1094–110410.1016/j.neunet.2008.05.007 - DOI - PMC - PubMed
    1. Cunningham M. O., Whittington M. A., Bibbig A., Roopun A. K., LeBeau F. E. N., Vogt M., Monyer H., Buhl E. H., Traub R. D. (2004). A role for fast rhythmic bursting neurons in cortical gamma oscillations in vitro. Proc. Natl. Acad. Sci. U.S.A. 101, 7152–715710.1073/pnas.0402060101 - DOI - PMC - PubMed

LinkOut - more resources