. 2010 Apr;9(2):174-90.
doi: 10.1111/j.1474-9726.2010.00547.x.

Altered longevity-assurance activity of p53:p44 in the mouse causes memory loss, neurodegeneration and premature death

Affiliations
Free PMC article

Altered longevity-assurance activity of p53:p44 in the mouse causes memory loss, neurodegeneration and premature death

Mariana Pehar et al. Aging Cell. 2010 Apr.
Free PMC article

Abstract

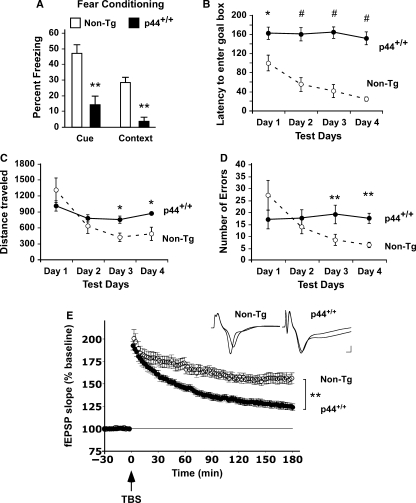
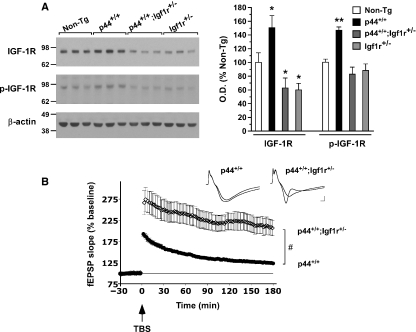
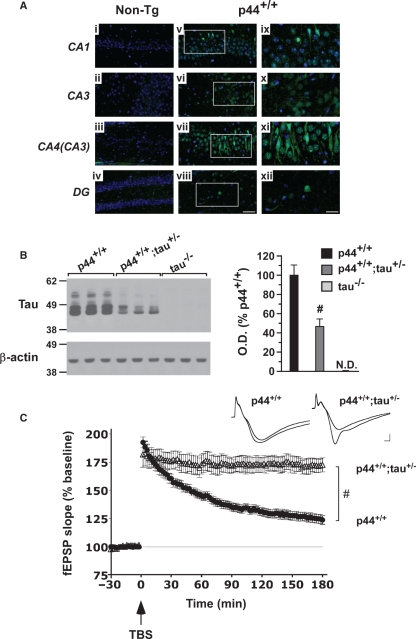
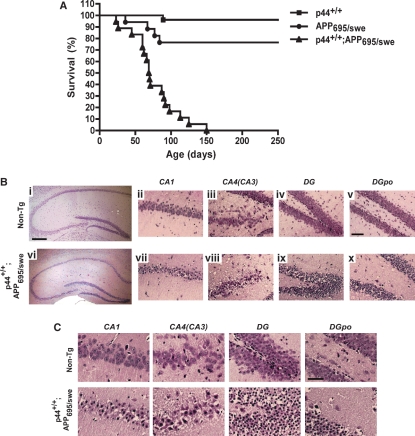
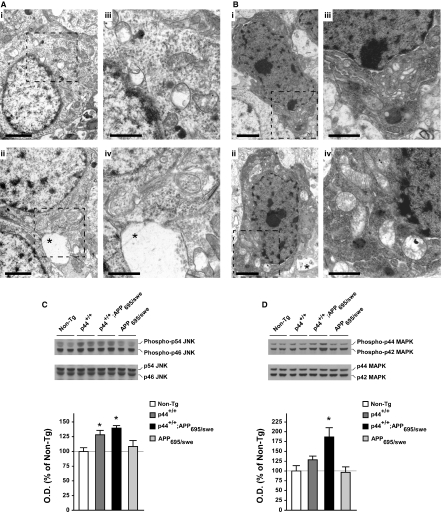
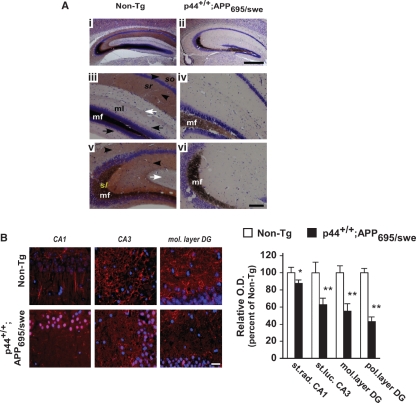
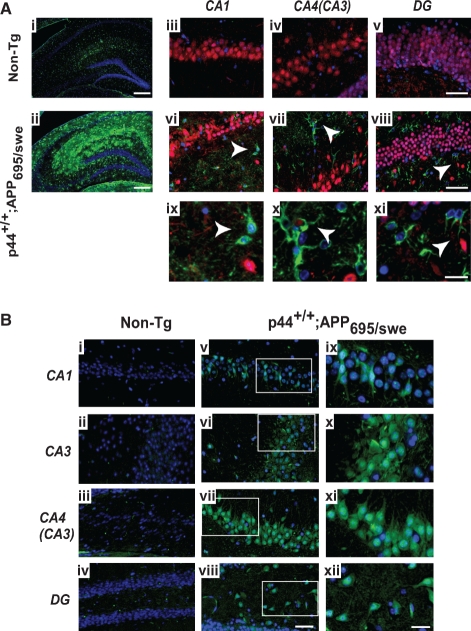
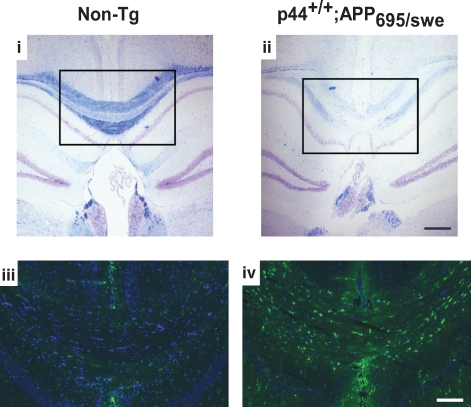
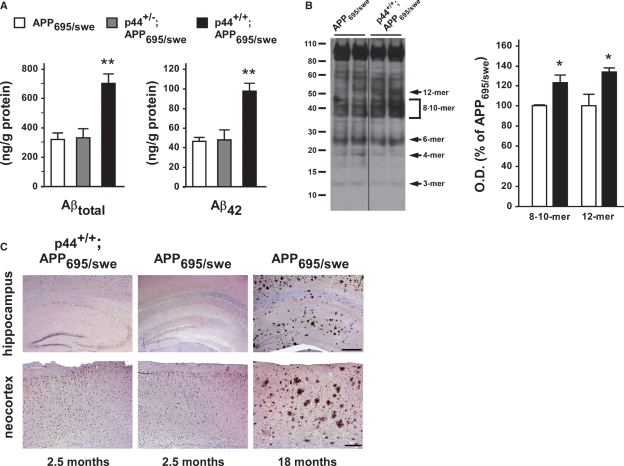
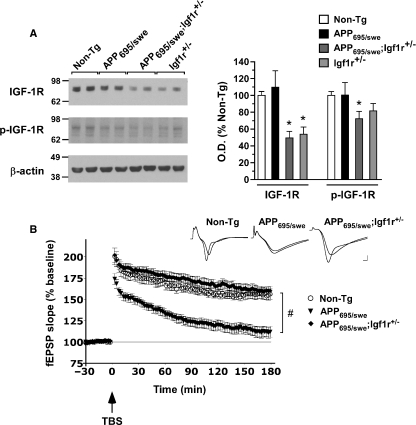
The longevity-assurance activity of the tumor suppressor p53 depends on the levels of Delta40p53 (p44), a short and naturally occurring isoform of the p53 gene. As such, increased dosage of p44 in the mouse leads to accelerated aging and short lifespan. Here we show that mice homozygous for a transgene encoding p44 (p44(+/+)) display cognitive decline and synaptic impairment early in life. The synaptic deficits are attributed to hyperactivation of insulin-like growth factor 1 receptor (IGF-1R) signaling and altered metabolism of the microtubule-binding protein tau. In fact, they were rescued by either Igf1r or Mapt haploinsufficiency. When expressing a human or a 'humanized' form of the amyloid precursor protein (APP), p44(+/+) animals developed a selective degeneration of memory-forming and -retrieving areas of the brain, and died prematurely. Mechanistically, the neurodegeneration was caused by both paraptosis- and autophagy-like cell deaths. These results indicate that altered longevity-assurance activity of p53:p44 causes memory loss and neurodegeneration by affecting IGF-1R signaling. Importantly, Igf1r haploinsufficiency was also able to correct the synaptic deficits of APP(695/swe) mice, a model of Alzheimer's disease.


Figures

Fig. 1
Fig. 1
p44+/+ single-transgenics display memory and synaptic defects. (A) Fear conditioning assessment of 2.5-month-old male p44+/+ (n= 9) and nontransgenic (non-Tg; n= 14) littermates. Results show percentage of freezing. (B–D) Barnes maze assessment of 10-month-old male p44+/+ and non-Tg littermates showing latency to enter in the goal box (B, n= 12, both groups), distance traveled (C, n= 6, both groups) and number of errors (D, n= 12, both groups). (E) Long-term potentiation (LTP) induction in hippocampal slices of 2.5-month-old male p44+/+ and non-Tg littermates. p44+/+ [n= 37(12)] lack the late component of LTP seen in non-Tg mice [n= 11(5)]. Inset: typical recordings at the beginning (prior to stimulation) and end of the experiments. Calibration: 1 mV, 1 ms. The basal synaptic excitatory transmission, as assessed by paired-pulse facilitation (PPF) and i/o curves, is shown in Fig. S2. All values are mean ± SEM. *P < 0.05, **P < 0.005, #P < 0.0005.
Fig. 2
Fig. 2
IGF-1R is responsible for the synaptic deficits of p44+/+ animals. (A) Expression levels of IGF-1R and phospho-IGF-1R (p-IGF-1R) in the hippocampal formation of 2.5-month-old male non-Tg, p44+/+, p44+/+;Igf1r+/−, and Igf1r+/− animals. A representative Western blot of three different animals is shown in the left panel, whereas the percentage of change is shown in the right panel (n= 4). (B) Enhanced hippocampal CA1 long-term potentiation (LTP) in 2.5-month-old male p44+/+;Igf1r+/− transgenic animals. Theta burst stimulation (TBS)-induced LTP was enhanced in p44+/+;Igf1r+/− mice [n= 10(3)] when compared to p44+/+ single-transgenics [n= 37(12)]. Insets: example traces before and after LTP for each group. Calibration 1 mV, 1 ms. No difference was observed in paired-pulse facilitation (PPF) or i/o curves (data not shown). All values are mean ± SEM. *P < 0.05; **P < 0.005, #P < 0.0005.
Fig. 3
Fig. 3
The abnormal metabolism of tau is responsible for the synaptic deficits of p44+/+ animals. (A) Immunostaining with AT8 antibody shows abnormal tau phosphorylation (Ser202 and Thr205) in the indicated subfields of the hippocampus and dentate gyrus of p44+/+ mice (v-xii). No staining is observed in non-Tg mice (i-iv). (ix-xii) show higher magnification of the indicated areas in (v-viii). AT8 immunoreactivity was mainly localized in neuronal cell bodies. Nuclei were counterstained with 4′,6-diamidino-2-phenylindole (DAPI) (blue). Scale bars: 40 μm (i-viii); 20 μm (ix-xii). Animals were 2.5-month old when analyzed. Immunostaining with a different anti-phospho-tau antibody is shown in Fig. S7. (B) Expression levels of tau in the hippocampal formation of 2.5-month-old male p44+/+ and p44+/+;tau+/− animals. A representative Western blot of three different animals is shown in the left panel, whereas the percentage of change is shown in the right panel (n= 4). Tau−/− mice are included as control for antibody specificity. ND: not detected. (C) Enhanced hippocampal CA1 long-term potentiation (LTP) in 2.5-month-old male p44+/+;tau+/− transgenic animals. Theta burst stimulation (TBS)-induced LTP was enhanced in p44+/+;tau+/− mice [n= 7(4)] when compared to p44+/+ single-transgenics [n= 37(12)]. Insets: example traces before and after LTP for each transgenic group. Calibration 1 mV, 1 ms. No difference was observed in paired-pulse facilitation (PPF) or i/o curves (data not shown). All values are mean ± SEM. #P < 0.0005.
Fig. 4
Fig. 4
Decreased lifespan and widespread degeneration of the hippocampal formation in double-transgenic p44+/+;APP695/swe mice. (A) Kaplan–Meier survival analysis for p44+/+ (squares), APP695/swe (circles) and double-transgenic p44+/+;APP695/swe (triangles) mice. The median survival time for p44+/+;APP695/swe mice was 69.5 days. In the double-transgenic group (n= 19) no animal survived longer than 5 months. At this time, the survival in the APP695/swe (n= 16) and p44+/+ (n= 26) groups was 76.5% and 96.1%, respectively. The survival curves were significantly different (P < 0.0005). (B) Hematoxylin and eosin stained brain sections of 2.5-month-old male non-Tg and p44+/+;APP695/swe double-transgenic mice. Bar in left panel (2.5×): 400 μm; bar in right panel (10×): 100 μm. (C) Higher-magnification images of (B). Bar: 50 μm. APP695/swe and p44+/+ animals are shown in Fig. S5. DG: Dentate Gyrus; DGpo: polymorph layer of the dentate gyrus; CA4(CA3) indicates the part of CA3 that inserts into the dentate gyrus.
Fig. 9
Fig. 9
Both paraptosis- and autophagy-like events are responsible for the neuronal degeneration in p44+/+;APP695/swe double transgenics. (A) Electron micrographs showing neurons undergoing paraptosis-like degeneration (i and ii). These neurons appeared lightly stained and preserved their overall morphology with normal nuclei and no evidence of chromatin condensation. Their cytoplasm displayed vacuoles and swollen mitochondria. iii and iv show higher magnification of the indicated areas in i and ii, respectively. p44+/+;APP695/swe double-transgenic mice also displayed dystrophic processes surrounding degenerating neurons (*, asterisk). Dilated ER (iv) and mitochondria (iii and iv), together with several cytoplasmic inclusions (iii and iv), are evident. The swollen mitochondria showed ruptured inner membranes (iii and iv). Scale bar: 2 μm for i and ii; 1 μm for iii and iv. Low-magnification images are shown in Fig. S9. Animals were 2.5-month old when analyzed. (B) Electron micrographs showing neurons undergoing dark cell degeneration (i and ii). They were strongly stained with osmium and displayed irregular morphology with highly electron dense cytoplasm containing dense vacuoles, swollen mitochondria and dilated ER-Golgi network. The mitochondria had very few cristae and exhibited rupture of the inner membrane. The nucleus appeared highly condensed with crenated nucleolemma and chromatin clustered in peripheral bundles. iii and iv show higher magnification of the indicated areas in i and ii, respectively. Scale bar: 2 μm for i and ii; 1 μm for iii and iv. Low-magnification images are shown in Fig. S9. Animals were 2.5-month old when analyzed. (C and D) Jun N-terminal kinases (JNK) (C) and mitogen-activated protein kinases (MAPK) (D) phosphorylation in the hippocampus of non-Tg, p44+/+, APP695/swe and p44+/+;APP695/swe mice. A representative Western blot of two different animals is shown in the upper panel whereas the percentage of change is shown in the lower panel (n= 4). The levels of JNK and MAPK phosphorylation were normalized against the levels of total JNK or MAPK protein, respectively. Animals were 2.5-month old when analyzed. Results are expressed as percentage of non-Tg and are the mean ± SEM. *P < 0.05.
Fig. 6
Fig. 6
Early loss of synaptic terminals in p44+/+;APP695/swe double-transgenic mice. (A) Timm’s sulfide silver staining of coronal brain sections of 1.5-month-old non-Tg (i, iii, v) and p44+/+;APP695/swe mice (ii, iv, vi). Images (iii) to (vi) show higher magnification of (i) and (ii). When compared to non-Tg, double-transgenic animals displayed a severe loss of Timm’s staining. Specifically, the mossy fibers (mf) showed a reduced staining whereas the ipsilateral and commissural hippocampodentate pathways (black arrows), the commissural and ipsilateral association systems in the CA1-CA3 stratum oriens and stratum radiatum (black arrow-heads), and the lateral perforant path (white arrows) could not be stained at all. Abbreviations: mf, mossy fibers; ml, dentate molecular layer; sl, CA3 stratum lucidum; so, stratum oriens; sr, stratum radiatum. Scale bars: 500 μm (i and ii) and 100 μm (iii-vi). APP695/swe and p44+/+ animals are shown in Fig. S8. (B) Representative microphotographs showing synaptophysin immunoreactivity (red) in brain sections of non-Tg and p44+/+;APP695/swe mice. Nuclei were counterstained with 4′,6-diamidino-2-phenylindole (DAPI) (blue). The ‘synaptic boutons’ are well visible in non-Tg mice but significantly reduced in double-transgenic mice. Scale bar: 25 μm. Graphic in right panel shows relative optical density (OD) quantification of synaptophysin immunoreactivity from CA1 stratum radiatum (st. rad.), CA3 stratum lucidum (st. luc.), molecular layer of dentate gyrus (mol. layer DG) and polymorph layer of dentate gyrus (pol. layer DG). Values are mean ± SEM. *P < 0.05, **P < 0.005.
Fig. 5
Fig. 5
Widespread astrogliosis and tau hyperphosphorylation in the hippocampus and dentate gyrus of p44+/+;APP695/swe double-transgenic mice. (A) Brain sections of 2.5-month-old non-Tg and p44+/+;APP695/swe double-transgenic mice were immunostained for GFAP (astrocytic marker; green) and NeuN (neuronal marker; red). Nuclei were counterstained with 4′,6-diamidino-2-phenylindole (DAPI) (blue). (i and ii) Low-magnification microphotographs showing GFAP immunoreactivity in the hippocampus and dentate gyrus of non-Tg and double-transgenic animals. (iii-viii) Higher magnification of CA1, CA4 and dentate gyrus (DG) of non-Tg (iii-v) and double-transgenic (vi-viii) mice. Arrowheads indicate the characteristic morphology of reactive astrocytes with hypertrophic soma and thick processes surrounding degenerating neurons. (ix-xi) Higher magnification of reactive astrocytes indicated in (vi-viii). Scale bars: 400 μm (i and ii); 50 μm (iii-viii) and 20 μm (ix-xi). APP695/swe and p44+/+ animals are shown in Fig. S6. (B) Immunostaining with AT8 antibody showing abnormal tau phosphorylation (Ser202 and Thr205) in the indicated subfields of the hippocampus and dentate gyrus from double-transgenic mice (v-viii). (ix-xii) Higher magnification of the indicated areas in (v-viii). AT8 immunoreactivity was mainly localized in neuronal cell bodies. Nuclei were counterstained with DAPI (blue). Images (i-iv) are also shown in Fig. 3A. Scale bars: 40 μm (i-viii); 20 μm (ix-xii). APP695/swe and p44+/+ animals, as well as immunostaining with a different anti-phospho-tau antibody, are shown in Fig. S7. Animals were 2.5-month old when analyzed.
Fig. 7
Fig. 7
Degeneration of the corpus callosum in p44+/+;APP695/swe double-transgenic mice. Luxol fast blue-Cresyl violet (Klüver–Barrera) staining of 2.5-month-old non-Tg and p44+/+;APP695/swe mice. Coronal brain sections at comparable anteroposterior levels are shown. Immunostaining for GFAP (green; iii, iv) of areas indicated in (i) and (ii) reveals that the myelin loss in p44+/+;APP695/swe mice is accompanied by prominent astrogliosis (green, iv). Nuclei were counterstained with 4′,6-diamidino-2-phenylindole (DAPI) (blue, iii and iv). Scale bars: 500 μm (i and ii); 250 μm (iii and iv).
Fig. 8
Fig. 8
p44+/+;APP695/swe transgenic mice have increased levels of Aβ but no amyloid plaques. (A) Soluble Aβ levels were measured by sandwich ELISA in brain homogenates (neocortex) of 2.5-month-old mice. p44+/+;APP695/swe mice display a ∼2-fold increase in the levels of both Aβtotal and Aβ42. No difference was observed with the Aβ42/Aβtotal ratio. Similar results were obtained in the hippocampus (data not shown). (B) Aβ oligomers were immunoprecipitated from brain homogenates (neocortex) with antibody 6E10 and analyzed by Western blot. The ‘Aβ-bands’ shown here were identified with 6E10 antibody (against aa. 1-16 of the Aβ region of APP), but not with 22C11 (against the N-terminus of APP), indicating that they are neither degradation nor cleavage-end products of APP. In addition, the above bands were not detected with AB5352, which recognizes C-terminal fragments of APP. The molecular masses correspond to previously published and characterized Aβ oligomers (Lesne et al., 2006). The 12-, 9-, 6-mer bands correspond to dodecameric (56-kDa), nonameric (40-kDa), and hexameric (27-kDa) Aβ aggregates. sAPP is also visible below the 110-kDa molecular marker. The graphic in the right panel shows relative optical density (OD) quantification of the indicated Aβ immunoreactive bands (expressed as percentage of APP695/swe mice). Animals were 2.5-month old when analyzed. (C) Immunostaining of Aβ deposits in the hippocampus and neocortex of 2.5-month-old p44+/+;APP695/swe, age-matched APP695/swe, and 18-month-old APP695/swe mice. Classical amyloid plaques were only observed in the old APP695/swe animals. Scale bar (hippocampus): 500 μm. Scale bar (neocortex): 200 μm. All values are mean ± SEM. *P < 0.05, **P < 0.005.
Fig. 10
Fig. 10
Down-regulation of IGF-1R improves the synaptic deficits of APP695/swe animals. (A) Expression levels of IGF-1R and phospho-IGF-1R (p-IGF-1R) in the hippocampal formation of non-Tg, APP695/swe, APP695/swe;Igf1r+/−, and Igf1r+/− animals. A representative Western blot of 2 different animals is shown in the left panel, whereas the percentage of change is shown in the right panel (n= 4). Animals were 2.5-month old when analyzed. (B) Enhanced hippocampal CA1 long-term potentiation (LTP) in APP695/swe;Igf1r+/− transgenic animals. Theta burst stimulation (TBS)-induced LTP was enhanced in APP695/swe;Igf1r+/− [n = 10(3)] compared to APP695/swe animals [n = 13(3)]. Non-Tg mice [11(4)] are also shown. Insets: example traces before and after LTP for each transgenic group. Calibration 1 mV, 1 ms. No difference was observed in the paired-pulse facilitation (PPF) or i/o curves (data not shown). Animals were 2.5-month old when analyzed. All values are mean ± SEM. *P < 0.05; #P < 0.0005.

Similar articles

Cited by

References

    1. Auer T, Barsi P, Bone B, Angyalosi A, Aradi M, Szalay C, Horvath RA, Kovacs N, Kotek G, Fogarasi A, Komoly S, Janszky I, Schwarcz A, Janszky J. History of simple febrile seizures is associated with hippocampal abnormalities in adults. Epilepsia. 2008;49:1562–1569. - PubMed
    1. Bancher C, Brunner C, Lassmann H, Budka H, Jellinger K, Wiche G, Seitelberger F, Grundke-Iqbal I, Iqbal K, Wisniewski HM. Accumulation of abnormally phosphorylated tau precedes the formation of neurofibrillary tangles in Alzheimer’s disease. Brain Res. 1989;477:90–99. - PubMed
    1. Bauer JH, Helfand SL. New tricks of an old molecule: lifespan regulation by p53. Aging Cell. 2006;5:437–440. - PMC - PubMed
    1. Borchelt DR, Thinakaran G, Eckman CB, Lee MK, Davenport F, Ratovitsky T, Prada CM, Kim G, Seekins S, Yager D, Slunt HH, Wang R, Seeger M, Levey AI, Gandy SE, Copeland NG, Jenkins NA, Price DL, Younkin SG, Sisodia SS. Familial Alzheimer’s disease-linked presenilin 1 variants elevate Abeta1-42/1-40 ratio in vitro and in vivo. Neuron. 1996;17:1005–1013. - PubMed
    1. Bourdon JC, Fernandes K, Murray-Zmijewski F, Liu G, Diot A, Xirodimas DP, Saville MK, Lane DP. p53 isoforms can regulate p53 transcriptional activity. Genes Dev. 2005;19:2122–2137. - PMC - PubMed

Publication types

MeSH terms