. 2010 Apr 21:10:73.
doi: 10.1186/1471-2229-10-73.

Epigenetic chromatin modifiers in barley: IV. The study of barley polycomb group (PcG) genes during seed development and in response to external ABA

Affiliations

Epigenetic chromatin modifiers in barley: IV. The study of barley polycomb group (PcG) genes during seed development and in response to external ABA

Aliki Kapazoglou et al. BMC Plant Biol. .

Abstract

Background: Epigenetic phenomena have been associated with the regulation of active and silent chromatin states achieved by modifications of chromatin structure through DNA methylation, and histone post-translational modifications. The latter is accomplished, in part, through the action of PcG (Polycomb group) protein complexes which methylate nucleosomal histone tails at specific sites, ultimately leading to chromatin compaction and gene silencing. Different PcG complex variants operating during different developmental stages have been described in plants. In particular, the so-called FIE/MEA/FIS2 complex governs the expression of genes important in embryo and endosperm development in Arabidopsis. In our effort to understand the epigenetic mechanisms regulating seed development in barley (Hordeum vulgare), an agronomically important monocot plant cultivated for its endosperm, we set out to characterize the genes encoding barley PcG proteins.

Results: Four barley PcG gene homologues, named HvFIE, HvE(Z), HvSu(z)12a, and HvSu(z)12b were identified and structurally and phylogenetically characterized. The corresponding genes HvFIE, HvE(Z), HvSu(z)12a, and HvSu(z)12b were mapped onto barley chromosomes 7H, 4H, 2H and 5H, respectively. Expression analysis of the PcG genes revealed significant differences in gene expression among tissues and seed developmental stages and between barley cultivars with varying seed size. Furthermore, HvFIE and HvE(Z) gene expression was responsive to the abiotic stress-related hormone abscisic acid (ABA) known to be involved in seed maturation, dormancy and germination.

Conclusion: This study reports the first characterization of the PcG homologues, HvFIE, HvE(Z), HvSu(z)12a and HvSu(z)12b in barley. All genes co-localized with known chromosomal regions responsible for malting quality related traits, suggesting that they might be used for developing molecular markers to be applied in marker assisted selection. The PcG differential expression pattern in different tissues and seed developmental stages as well as in two barley cultivars with different seed size is suggestive of a role for these genes in barley seed development. HvFIE and HvE(Z) were also found to be induced by the plant hormone ABA implying an association with ABA-mediated processes during seed development, germination and stress response.


Figures

Figure 1
Figure 1
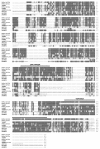
Alignment of the amino acid sequences of the FIE homologues in different plants. The sequences and accession numbers used for protein sequence analysis are shown in Table 1. Identical and similar amino acid residues are shaded in dark grey and light grey, respectively. WD 40 repeats are marked above the sequences with grey lines.
Figure 2
Figure 2
Alignment of the amino acid sequences of the E(Z) homologues from different plants. Sequences and accession numbers are shown in Table 1. Identical and similar amino acid residues are shaded in dark grey and light grey, respectively. The cysteine rich domain and the SET-domain are shown above the sequences with hatched and gray lines, respectively.
Figure 3
Figure 3
Alignment of the amino acid sequences of Su(z)12 protein homologues from different plants. Sequences and accession numbers are shown in Table 1. Identical and similar amino acid residues are shaded in dark grey and light grey, respectively. The Zinc-finger domain and the VEFS box are indicated by hatched and gray lines, respectively.
Figure 4
Figure 4
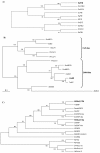
Phylogenetic analysis of PcG proteins. Phylogenetic trees of PcG homologues from different organisms. A) FIE. B) E(Z). C) Su(z)12. Barley sequences are in bold. Sequences and accession numbers are shown in Table 1.
Figure 5
Figure 5
Mapping of barley PcG genes. Chromosomal position of barley HvE(z) and HvFIE genes on the OWB molecular linkage map and HvSu(z)12a and HvSu(z12)b on the LxV molecular linkage map. Only non co-segregating markers are reported, with distances in Kosambi cM. The BIN where each PcG gene has been mapped is indicated following the notation of [49] that integrates data from 6 segregating populations including both the OWB and the LxV maps.
Figure 6
Figure 6
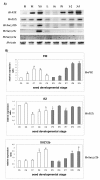
A) Qualitative RT-PCR expression analysis of barley PcG genes. R, roots; M, meristem; L, Leaves; YS, young shoots; St, stamens; Pi, unfertilized pistils; 1-2, 1-2 DAF; 3-5, 3-5 DAF; HvActin, was used as the internal control. Cultivar was Carina (a medium-grain cultivar). DAF, Days after fertilization. B) Quantitative real-time RT-PCR analysis of PcG >genes. Expression values were normalized to those of HvActin. The relative expression ratio of each sample is compared to the control group which was C5 (Caresse immature flowers). C, cultivar Caresse, (white bars); IP, cultivar Ippolytos (grey bars). 5, Immature flower; 6, Seed 1-3 DAF; 7, Seed 3-5 DAF; 8, Seed 5-10 DAF; 9, Seed 10-15 DAF. Data represent mean values from two independent experiments with standard deviations. Values significantly different (P < 0.05) from the control group (C5) are marked with an asterisk.
Figure 7
Figure 7
Expression analysis of barley PcG genes after treatment of seedlings with ABA. Quantitative real-time PCR analysis of HvFIE and HvE(Z) genes at 6 and 24 h after treatment of Caresse seedlings with 100 μM ABA. Expression values were normalized to those of HvActin. Data represent mean values from two independent experiments with standard deviations. Relative expression ratio of each sample was compared to the control group which was untreated plants, 0 h, and was assigned the value of 1. Grey bars, hormone-treated plants for 6 h and 24 h; white bars, no hormone treated plants (mocked with H2O/Tween for 6 h and 24 h, respectively). Values significantly different (P < 0.05) from the control group are marked with an asterisk. The barley gene HVA22 (known to be induced by ABA) was used as positive control.

Similar articles

Cited by

References

    1. Goldberg AD, Allis CD, Bernstein E. Epigenetics: a landscape takes shape. Cell. 2007;128:635–38. doi: 10.1016/j.cell.2007.02.006. - DOI - PubMed
    1. Wu JI, Lessard J, Crabtree GR. Understanding the words of chromatin regulation. Cell. 2009;136:200–206. doi: 10.1016/j.cell.2009.01.009. - DOI - PMC - PubMed
    1. Chen ZJ, Tian L. Roles of dynamic and reversible histone acetylation in plant development and polyploidy. Biochim Biophys Acta. 2007;1769:295–307. - PMC - PubMed
    1. Chinnusamy V, Gong Z, Zhu JK. Abscisic acid-mediated epigenetic processes in plant development and stress responses. J Integr Plant Biol. 2008;50:1187–1195. doi: 10.1111/j.1744-7909.2008.00727.x. - DOI - PMC - PubMed
    1. Chinnusamy V, Zhu JK. Epigenetic regulation of stress responses in plants. Curr Opin Plant Biol. 2009;12:133–139. doi: 10.1016/j.pbi.2008.12.006. - DOI - PMC - PubMed

Publication types

MeSH terms

LinkOut - more resources