MochiView: versatile software for genome browsing and DNA motif analysis
- PMID: 20409324
- PMCID: PMC2867778
- DOI: 10.1186/1741-7007-8-49
MochiView: versatile software for genome browsing and DNA motif analysis
Abstract
Background: As high-throughput technologies rapidly generate genome-scale data, it becomes increasingly important to visually integrate these data so that specific hypotheses can be formulated and tested.
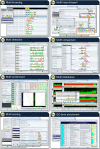
Results: We present MochiView, a platform-independent Java software that integrates browsing of genomic sequences, features, and data with DNA motif visualization and analysis in a visually-appealing and user-friendly application.
Conclusions: While highly versatile, the software is particularly useful for organizing, exploring, and analyzing large genomic data sets, such as those from deep RNA sequencing, chromatin immunoprecipitation experiments (ChIP-Seq and ChIP-Chip), and transcriptional profiling. MochiView provides an extensive suite of utilities to identify and to explore connections between these data sets and short sequence motifs present in DNA or RNA.
Figures


Similar articles
-
Using CisGenome to analyze ChIP-chip and ChIP-seq data.Curr Protoc Bioinformatics. 2011 Mar;Chapter 2:Unit2.13. doi: 10.1002/0471250953.bi0213s33. Curr Protoc Bioinformatics. 2011. PMID: 21400695 Free PMC article.
-
A MAD-Bayes Algorithm for State-Space Inference and Clustering with Application to Querying Large Collections of ChIP-Seq Data Sets.J Comput Biol. 2017 Jun;24(6):472-485. doi: 10.1089/cmb.2016.0138. Epub 2016 Nov 11. J Comput Biol. 2017. PMID: 27835030 Free PMC article.
-
Seqinspector: position-based navigation through the ChIP-seq data landscape to identify gene expression regulators.BMC Bioinformatics. 2016 Feb 12;17:85. doi: 10.1186/s12859-016-0938-4. BMC Bioinformatics. 2016. PMID: 26868127 Free PMC article.
-
Computation for ChIP-seq and RNA-seq studies.Nat Methods. 2009 Nov;6(11 Suppl):S22-32. doi: 10.1038/nmeth.1371. Nat Methods. 2009. PMID: 19844228 Free PMC article. Review.
-
DNA sequence motif: a jack of all trades for ChIP-Seq data.Adv Protein Chem Struct Biol. 2013;91:135-71. doi: 10.1016/B978-0-12-411637-5.00005-6. Adv Protein Chem Struct Biol. 2013. PMID: 23790213 Review.
Cited by
-
MotifLab: a tools and data integration workbench for motif discovery and regulatory sequence analysis.BMC Bioinformatics. 2013 Jan 16;14:9. doi: 10.1186/1471-2105-14-9. BMC Bioinformatics. 2013. PMID: 23323883 Free PMC article.
-
RAS/cyclic AMP and transcription factor Msn2 regulate mating and mating-type switching in the yeast Kluyveromyces lactis.Eukaryot Cell. 2011 Nov;10(11):1545-52. doi: 10.1128/EC.05158-11. Epub 2011 Sep 2. Eukaryot Cell. 2011. PMID: 21890818 Free PMC article.
-
A conserved transcriptional regulator governs fungal morphology in widely diverged species.Genetics. 2012 Feb;190(2):511-21. doi: 10.1534/genetics.111.134080. Epub 2011 Nov 17. Genetics. 2012. PMID: 22095082 Free PMC article.
-
Comprehensive analysis of iron utilization by Mycobacterium tuberculosis.PLoS Pathog. 2020 Feb 18;16(2):e1008337. doi: 10.1371/journal.ppat.1008337. eCollection 2020 Feb. PLoS Pathog. 2020. PMID: 32069330 Free PMC article.
-
Tandem repeats and G-rich sequences are enriched at human CNV breakpoints.PLoS One. 2014 Jul 1;9(7):e101607. doi: 10.1371/journal.pone.0101607. eCollection 2014. PLoS One. 2014. PMID: 24983241 Free PMC article.
References
-
- Boyle EI, Weng S, Gollub J, Jin H, Botstein D, Cherry JM, Sherlock G. GO:TermFinder--open source software for accessing Gene Ontology information and finding significantly enriched Gene Ontology terms associated with a list of genes. Bioinformatics. 2004;20:3710–3715. doi: 10.1093/bioinformatics/bth456. - DOI - PMC - PubMed
Publication types
MeSH terms
Grants and funding
LinkOut - more resources
Full Text Sources
Other Literature Sources
Molecular Biology Databases
Research Materials

