. 2010 Apr 21:11:198.
doi: 10.1186/1471-2105-11-198.

Predictors of natively unfolded proteins: unanimous consensus score to detect a twilight zone between order and disorder in generic datasets

Affiliations

Predictors of natively unfolded proteins: unanimous consensus score to detect a twilight zone between order and disorder in generic datasets

Antonio Deiana et al. BMC Bioinformatics. .

Abstract

Background: Natively unfolded proteins lack a well defined three dimensional structure but have important biological functions, suggesting a re-assignment of the structure-function paradigm. To assess that a given protein is natively unfolded requires laborious experimental investigations, then reliable sequence-only methods for predicting whether a sequence corresponds to a folded or to an unfolded protein are of interest in fundamental and applicative studies. Many proteins have amino acidic compositions compatible both with the folded and unfolded status, and belong to a twilight zone between order and disorder. This makes difficult a dichotomic classification of protein sequences into folded and natively unfolded ones. In this work we propose an operational method to identify proteins belonging to the twilight zone by combining into a consensus score good performing single predictors of folding.

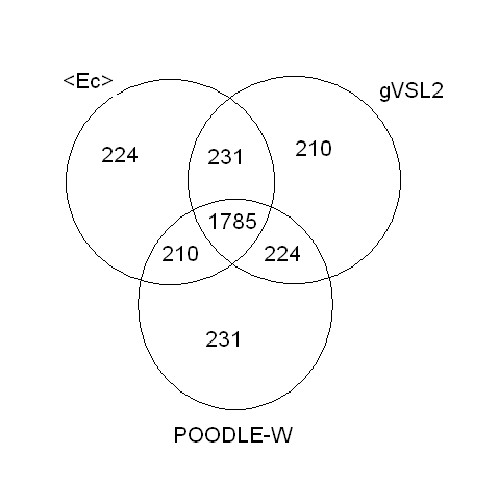
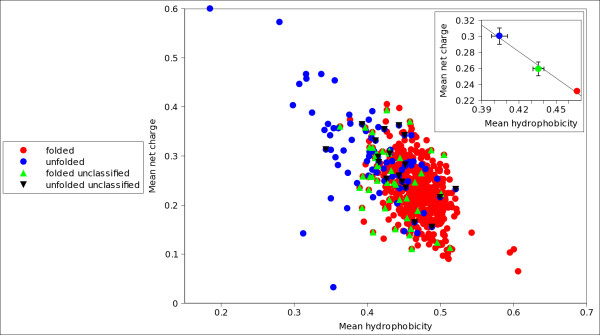
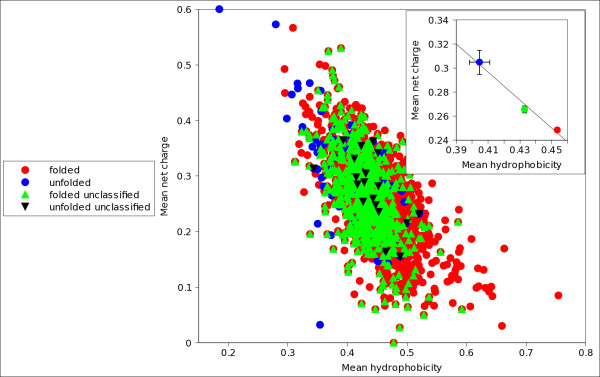
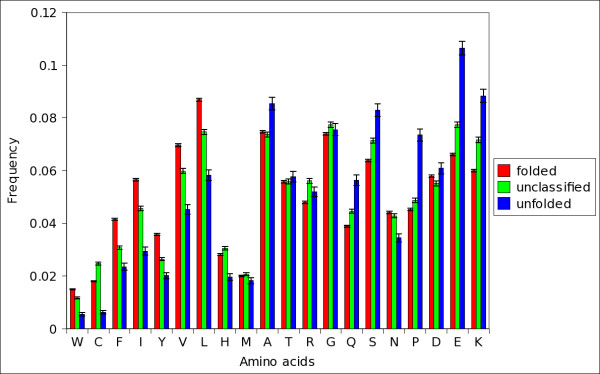
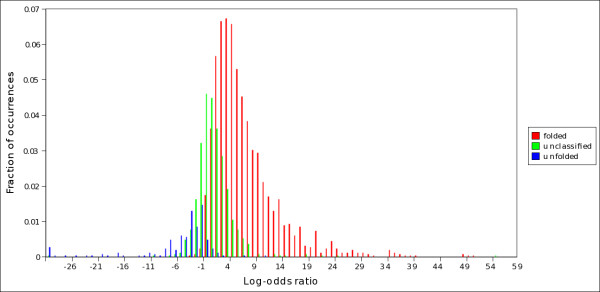
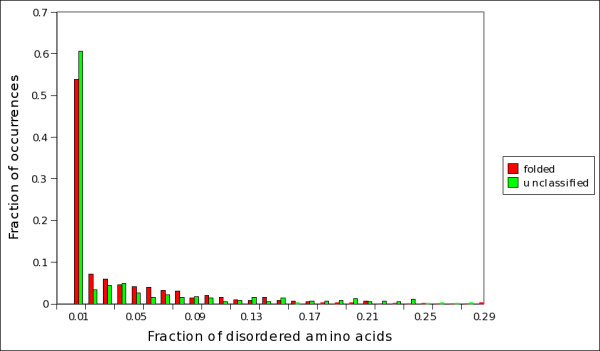
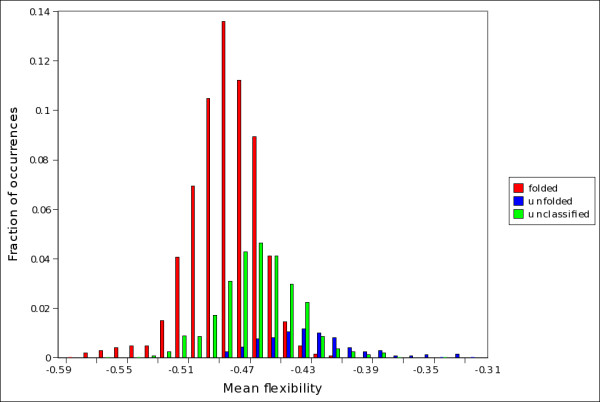
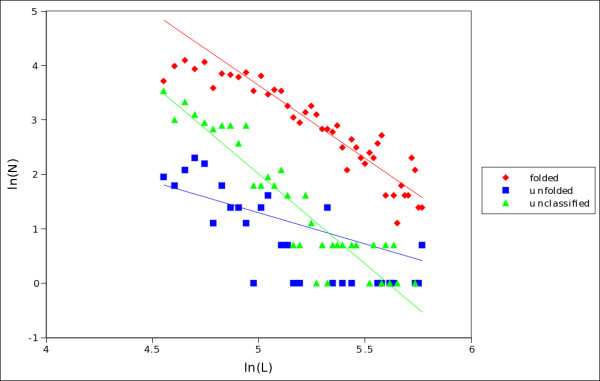
Results: In this methodological paper dichotomic folding indexes are considered: hydrophobicity-charge, mean packing, mean pairwise energy, Poodle-W and a new global index, that is called here gVSL2, based on the local disorder predictor VSL2. The performance of these indexes is evaluated on different datasets, in particular on a new dataset composed by 2369 folded and 81 natively unfolded proteins. Poodle-W, gVSL2 and mean pairwise energy have good performance and stability in all the datasets considered and are combined into a strictly unanimous combination score SSU, that leaves proteins unclassified when the consensus of all combined indexes is not reached. The unclassified proteins: i) belong to an overlap region in the vector space of amino acidic compositions occupied by both folded and unfolded proteins; ii) are composed by approximately the same number of order-promoting and disorder-promoting amino acids; iii) have a mean flexibility intermediate between that of folded and that of unfolded proteins.

Conclusions: Our results show that proteins unclassified by SSU belong to a twilight zone. Proteins left unclassified by the consensus score SSU have physical properties intermediate between those of folded and those of natively unfolded proteins and their structural properties and evolutionary history are worth to be investigated.


Figures

Figure 1
Figure 1
Overlaps between the predictions of single indexes. Comparison of the predictions by mean pairwise energy, gVSL2 and Poodle-W, on set C. The three indexes agree on 1785 proteins predicting them in the same class; 224, 210 and 231 proteins are singly classified by each of the indexes respectively, on each one of these proteins the prediction of one index is at variance with those of the others; the remaining figures refer to the pairwise cross-predictions.
Figure 2
Figure 2
Hydrophobicity/charge plot of folded, unfolded and unclassified proteins in set B. Hydrophobicity/charge plot of proteins in set B, experimentally identified as folded (red) and unfolded (blue). Upper green triangles refer to folded proteins unclassified by SSU, lower black triangles refer to unfolded proteins unclassified by SSU . This plot is a projection of the vector space of amino acidic compositions. Hydrophobicity and charge have been computed following ref. [25].
Figure 3
Figure 3
Hydrophobicity/charge plot of folded, unfolded and unclassified proteins in set C. Hydrophobicity/charge plot of proteins in set C, experimentally identified as folded (red) and unfolded (blue). Upper green triangles refer to folded proteins unclassified by SSU, lower black triangles refer to unfolded proteins unclassified by SSU. Note the substantial overlap of folded (red) with unfolded proteins (blue), due to the presence of a higher number of untypical folded proteins in this set with respect of set B (figure 2). Nevertheless, the centroids of the three distributions (see inset) are aligned and that of unclassified proteins is in between, indicating that the twilight zone is intermediate.
Figure 4
Figure 4
Amino acidic percent composition of folded, unfolded and unclassified proteins. Amino acidic composition histograms of proteins in set C that are predicted as folded (red, left bars) and unfolded (blue, right bars) by SSU; the central bars in green refer to unclassified proteins. The error bars are estimated from the variance formula given in the methods.
Figure 5
Figure 5
Distribution of the log-odds ratio S in folded, unfolded and unclassified proteins (twilight zone). Distribution of log-odds ratios in predicted folded (red bars), unfolded (blue bars) and unclassified proteins (green bars), as evaluated by SSU on set C. From this graph the twilight zone can be defined as the set of proteins whose S-scores are sufficiently close to zero.
Figure 6
Figure 6
Fraction of disordered amino acids in folded, unfolded and unclassified proteins (twilight zone). Fraction of disordered amino acids in predicted folded (red bars) and unclassified (green bars) proteins, as evaluated by SSU from set C. A residue is disordered if it is present in the SEQRES but not in the ATOM field in the PDB file of the protein [33].
Figure 7
Figure 7
Distribution of mean flexibility in folded, unfolded and unclassified proteins (twilight zone). Distribution of mean flexibility in predicted folded (red bars), unfolded (blue bars) and unclassified protein (green bars), as evaluated by SSU on set C.
Figure 8
Figure 8
Distribution of lengths in folded, unfolded and unclassified proteins (twilight zone). Log-log plots of the distribution of lengths in the three classes of proteins extracted by SSU from set C. The scaling exponents, evaluated from a regression of the power law region in each graph are: -2.7 ± 0.2 (folded, red data points); -1.2 ± 0.3 (unfolded, blue); -3.3 ± 0.2 (unclassified, green).

Similar articles

Cited by

References

    1. Wright P, Dyson HJ. Intrinsically unstructured proteins: re-assessigning the protein structure-function paradigm. J Mol Biol. 1999;293:321–331. doi: 10.1006/jmbi.1999.3110. - DOI - PubMed
    1. Dyson HJ, Wright P. Intrinsically unstructured proteins and their functions. Nat Rev Mol Cell Biol. 2005;6:197–208. doi: 10.1038/nrm1589. - DOI - PubMed
    1. Dunker A, Lawson J, Brown C, Romero P, Oh J, Oldfield C, Campen A, Ratliffl C, Hipps K, Ausio J, Nissen M, Reeves R, Kang C, Kissinger C, Bailey R, Griswold M, Chin W, Garner E, Obradovic Z. Intrinsically disordered proteins. J Mol Graph Model. 2001;19:26–59. doi: 10.1016/S1093-3263(00)00138-8. - DOI - PubMed
    1. Demchenko AP. Recognition between flexible protein molecules: induced and assisted folding. J Mol Recognit. 2001;14:42–61. doi: 10.1002/1099-1352(200101/02)14:1<42::AID-JMR518>3.0.CO;2-8. - DOI - PubMed
    1. Uversky VN. Natively unfolded proteins: a point where biology waits for physics. Protein Sci. 2002;11:739–756. doi: 10.1110/ps.4210102. - DOI - PMC - PubMed

LinkOut - more resources