. 2010 Apr 21;98(8):1589-97.
doi: 10.1016/j.bpj.2009.12.4323.

One-dimensional Brownian motion of charged nanoparticles along microtubules: a model system for weak binding interactions

Affiliations

One-dimensional Brownian motion of charged nanoparticles along microtubules: a model system for weak binding interactions

Itsushi Minoura et al. Biophys J. .

Abstract

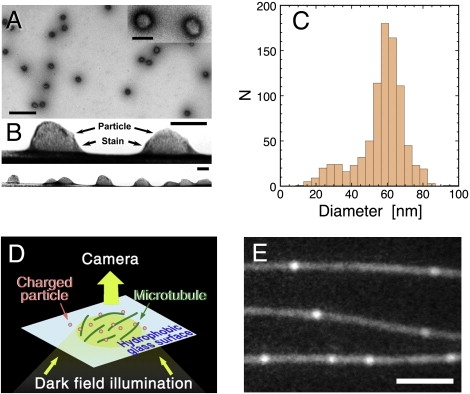
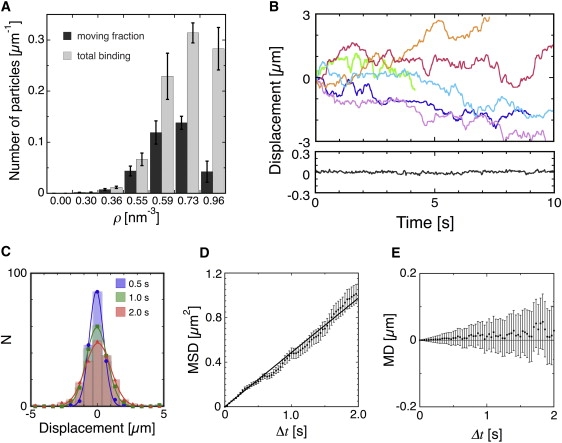
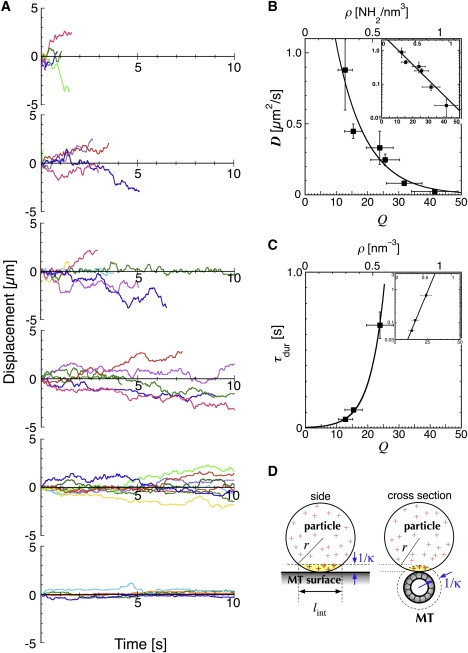
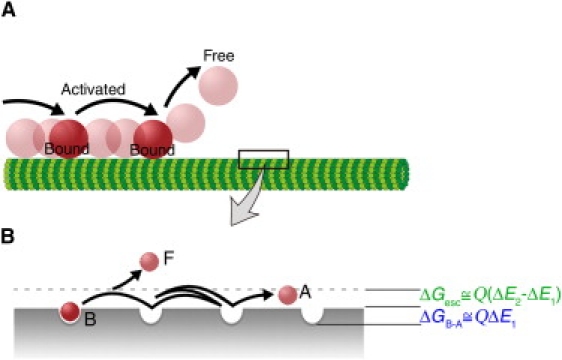
Various proteins are known to exhibit one-dimensional Brownian motion along charged rodlike polymers, such as microtubules (MTs), actin, and DNA. The electrostatic interaction between the proteins and the rodlike polymers appears to be crucial for one-dimensional Brownian motion, although the underlying mechanism has not been fully clarified. We examined the interactions of positively-charged nanoparticles composed of polyacrylamide gels with MTs. These hydrophilic nanoparticles bound to MTs and displayed one-dimensional Brownian motion in a charge-dependent manner, which indicates that nonspecific electrostatic interaction is sufficient for one-dimensional Brownian motion. The diffusion coefficient decreased exponentially with an increasing particle charge (with the exponent being 0.10 kBT per charge), whereas the duration of the interaction increased exponentially (exponent of 0.22 kBT per charge). These results can be explained semiquantitatively if one assumes that a particle repeats a cycle of binding to and movement along an MT until it finally dissociates from the MT. During the movement, a particle is still electrostatically constrained in the potential valley surrounding the MT. This entire process can be described by a three-state model analogous to the Michaelis-Menten scheme, in which the two parameters of the equilibrium constant between binding and movement, and the rate of dissociation from the MT, are derived as a function of the particle charge density. This study highlights the possibility that the weak binding interactions between proteins and rodlike polymers, e.g., MTs, are mediated by a similar, nonspecific charge-dependent mechanism.


Figures

Figure 1
Figure 1
Preparation of the charged nanoparticles and the experimental system used for observations of the particle-MT interaction. (A) Negatively-stained image of polyacrylamide particles after fractionation via sucrose density gradient centrifugation. Bar = 500 nm. (Inset) Magnified view (bar = 100 nm). The aspect ratio of the particle (ratio of major to minor axis) was 1.13 ± 0.13 (mean ± SD, n = 865), indicating that particles can be regarded as spheres rather than ellipsoids. (B) A side view of the particles showing their flattening on the charged surface of the carbon film (bar = 100 nm). Such side views were obtained from a few accidental occasions where the carbon film was torn and curved. Based on such images, a ratio of equatorial radius to height, a measure of shape flattening, was calculated to be 1.27 ± 0.16 (n = 11). (C) Distribution of the particle diameters for a fraction of particles with an amine density 0.96 nm−3, after correction for shape flattening. The average of the diameters was 57 ± 13 nm (mean ± SD, n = 865). For details of the diameter measurement, see Fig. S1 and Methods in the Supporting Material. (D) Interactions between charged nanoparticles and MTs were observed by DFM. To eliminate the electrostatic interactions of particles or MTs with the glass surface, MTs were attached to a hydrophobically modified glass surface (see Materials and Methods for details). (E) A representative DFM image of nanoparticles interacting with MTs. Bar = 3 μm.
Figure 2
Figure 2
Interaction of the charged nanoparticles with the MTs. (A) Binding of charged nanoparticles to the MTs examined by DFM. The total number of particles on the MTs (shaded) and the number of moving particles (solid) per unit length of the MTs are plotted as a function of the amine densities of the particles. One minute after the particle suspension was introduced into the flow cell, 9–18 fields were scanned within 5 min and their images were recorded for later analysis. For each MT, the numbers of moving (SD ≥ 30 nm) and stationary (SD < 30 nm) particles during a single 10-s observation period were counted. The numbers of moving/stationary particles on MT lengths of 300–800 μm were summed, normalized for the particle concentration used in each experiment (Table S1) and divided by the MT lengths, which gave the number of bound/moving particles per unit length of MT. (B) Examples of the back-and-forth movements of the charged particles along the MTs. Each trace shows the track of an individual nanoparticle with amine density of 0.59 nm−3. The upper and lower panels show the motions parallel and perpendicular to the long axes of the MT, respectively. In the upper panel, displacement in the plus direction corresponds to motion toward the MT-plus end. (C) Distributions of the particle displacements in 0.5-, 1.0-, and 2.0-s intervals. (D) MSD and (E) mean displacement of the particles plotted against time. The error bars represent mean ± SE.
Figure 3
Figure 3
Analysis of one-dimensional Brownian motion. (A) Typical traces for the displacements of particles with amine densities of (from the top downwards) 0.30, 0.36, 0.55, 0.59, 0.73, and 0.96 nm−3. (B) Diffusion constant of the particle, D, plotted against ρ or Q. D is the average of more than five independent diffusion constants, each calculated from an MSD plot for >10 particles over a total sampling time of 20 s. The error bars in the vertical and horizontal axes represent SD. The diffusion constant D appears to be an exponential function of Q, i.e., the data show good fit to the equation:D/D0=eQΔE1/kBT, where D0 = 3.0 μm2/s and ΔE1 = 0.10 kBT per charge (inset). (C) Mean duration of the interaction plotted against ρ or Q. The error bars represent standard error of fit (vertical axis) and SD (horizontal axis). The data show good fit to the equation:τ/0τdur=eQΔE2/kBT, where τ0 = 3.6 ms and ΔE2 = 0.22 kBT per charge (inset). (D) Q was calculated based on the amine density of the particle (ρ), radius of the particle and MT, and the Debye length (κ−1 = 1.29 nm). For a particle of diameter 59 nm, Q = 43.2 × ρ, and lint = 17 nm (see Materials and Methods for details).
Figure 4
Figure 4
Three-state model for one-dimensional Brownian motion of charged nanoparticles along MTs. (A) Schematic diagram showing that one-dimensional Brownian motion comprises three states: the particle undergoes repeated cycles of binding to and movement along the MT until it finally dissociates from the MT. (B) The postulated distribution of potential energy along the MT.

References

    1. Okada Y., Hirokawa N. A processive single-headed motor: kinesin superfamily protein KIF1A. Science. 1999;283:1152–1157. - PubMed
    1. Wang Z., Sheetz M.P. One-dimensional diffusion on microtubules of particles coated with cytoplasmic dynein and immunoglobulins. Cell Struct. Funct. 1999;24:373–383. - PubMed
    1. Inoue Y., Iwane A.H., Yanagida T. Motility of single one-headed kinesin molecules along microtubules. Biophys. J. 2001;81:2838–2850. - PMC - PubMed
    1. Helenius J., Brouhard G., Howard J. The depolymerizing kinesin MCAK uses lattice diffusion to rapidly target microtubule ends. Nature. 2006;441:115–119. - PubMed
    1. Kobayashi T., Shiroguchi K., Toyoshima Y.Y. Microtubule-binding properties of dynactin p150 expedient for dynein motility. Biochem. Biophys. Res. Commun. 2006;340:23–28. - PubMed

Publication types

LinkOut - more resources