. 2010 Apr 21;98(8):1668-76.
doi: 10.1016/j.bpj.2009.12.4309.

Assembly pathway of a designed alpha-helical protein fiber

Affiliations

Assembly pathway of a designed alpha-helical protein fiber

Elizabeth H C Bromley et al. Biophys J. .

Abstract

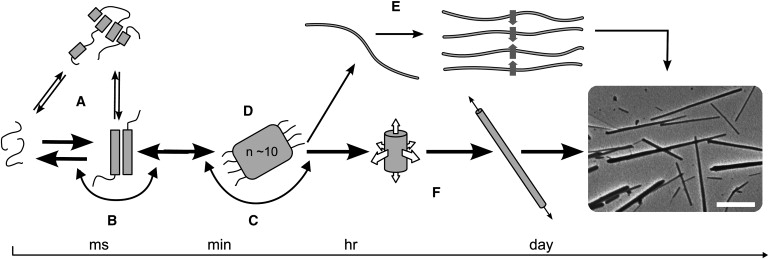
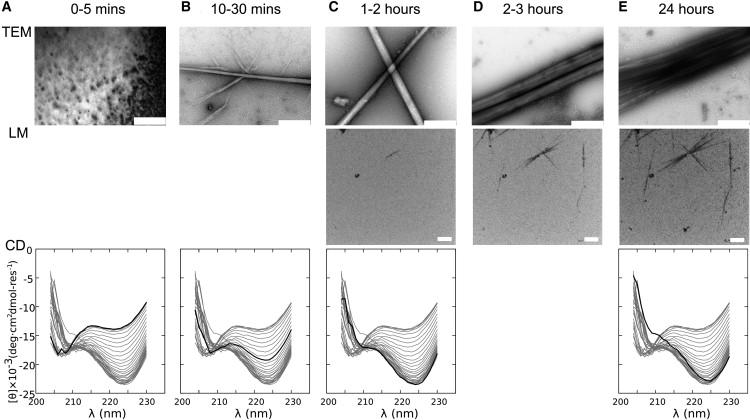
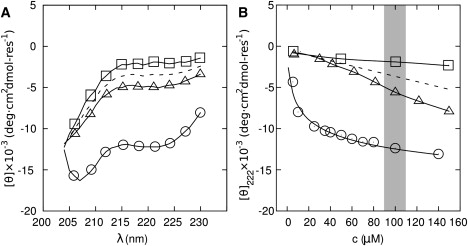
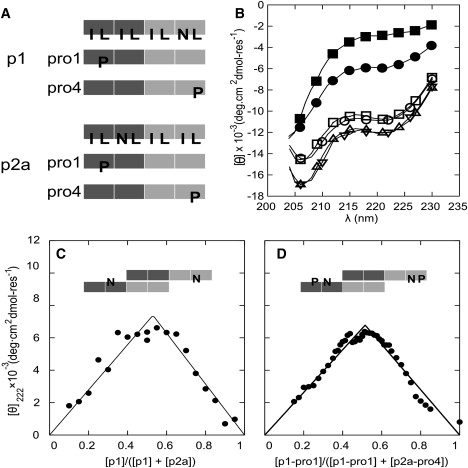
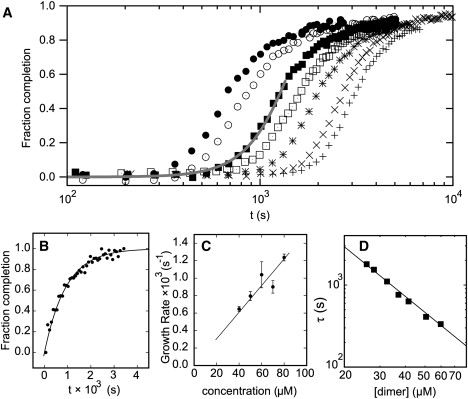
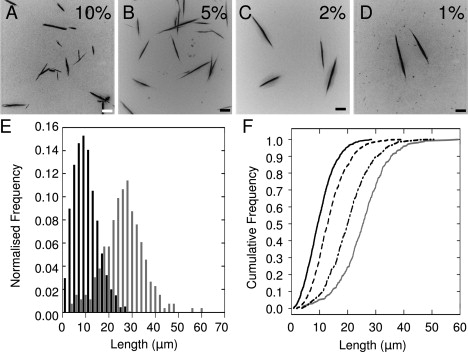
Interest in the design of peptide-based fibrous materials is growing because it opens possibilities to explore fundamental aspects of peptide self-assembly and to exploit the resulting structures--for example, as scaffolds for tissue engineering. Here we investigate the assembly pathway of self-assembling fibers, a rationally designed alpha-helical coiled-coil system comprising two peptides that assemble on mixing. The dimensions spanned by the peptides and final structures (nanometers to micrometers), and the timescale over which folding and assembly occur (seconds to hours), necessitate a multi-technique approach employing spectroscopy, analytical ultracentrifugation, electron and light microscopy, and protein design to produce a physical model. We show that fibers form via a nucleation and growth mechanism. The two peptides combine rapidly (in less than seconds) to form sticky ended, partly helical heterodimers. A lag phase follows, on the order of tens of minutes, and is concentration-dependent. The critical nucleus comprises six to eight partially folded dimers. Growth is then linear in dimers, and subsequent fiber growth occurs in hours through both elongation and thickening. At later times (several hours), fibers grow predominantly through elongation. This kinetic, biomolecular description of the folding-and-assembly process allows the self-assembling fiber system to be manipulated and controlled, which we demonstrate through seeding experiments to obtain different distributions of fiber lengths. This study and the resulting mechanism we propose provide a potential route to achieving temporal control of functional fibers with future applications in biotechnology and nanoscale science and technology.


Figures

Figure 1
Figure 1
Schematic of possible pathways for fiber formation. (A) The two peptides may interact to form various oligomers that are competent for fibrillogenesis, or (B) the individual peptides may be competent for assembly. (C) Onward assembly may be immediately energetically favorable, or (D) further assembly may only be favorable once a critical nucleus has formed. (E) Fibers may thicken via the bundling of fibrils, or (F) the addition of material in both radial and longitudinal directions yields mature fibers as shown in the electron micrograph (scale bar: 5 μm). The pathway determined from the experiments described herein is shown in bold.
Figure 2
Figure 2
Overview of the SAF folding and assembly probed by TEM, LM, and CD spectroscopy. (A) t = 0–5 min; no change in the CD spectrum, and no fibers by TEM or LM (0% material in fibers). (B) t = 10–30 min; the CD spectra begin to change, and small fibers become visible by TEM but not LM (5–50% material in fibers). (C) t = 1–2 h; the CD spectra continue to change, TEM shows an increase in number and thickness of the fibers, and fibrous material begins to appear by fluorescence microscopy (55–65% material in fibers). (D) t = 2–3 h; fibers are unchanged by TEM (which is insensitive to fiber length), but the LM reports elongation (65–70% material in fibers). (E) t = 24 h; the CD spectrum reaches equilibrium, the TEM shows mature striated fibers, and growth is complete in the LM (70% material in fibers). Scale bar: 500 nm for TEM and 10 μm for LM; heavy lines indicate the CD spectrum for the corresponding time point. The percentages of material in fibers given in brackets were estimated as follows: the final figure of 70% came from estimates of material that remained soluble 1), after matured fibers were pelleted by AUC, and 2), the remaining NMR signal after completion of fibrillogenesis (see the Supporting Material for details regarding both of these experiments). All other figures came from the percentage completion of fibrillogenesis from the time-resolved CD data. The kinetic CD experiments were repeated three times and provided similar qualitative results, indicating a batch-to-batch variation in rates and lag times of ∼10–15%. The LM and TEM experiments were repeated multiple times (more than six) and gave qualitatively similar results.
Figure 3
Figure 3
Initial folding of SAF-p1 and SAF-p2a upon mixing. (A) CD spectra of the SAF peptides: 100 μM SAF-p1 (▵), 100 μM SAF-p2a (□), average of these spectra (dashed line); and for the mixture 100 μM in each peptide at t = 0 (○). (B) Concentration dependence of the CD signal at 222 nm for SAF-p1 (▵), SAF-p2a (□), the average of these signals (dashed line), and the initial mixture (○). The curve for the mixture shows a fit to a monomer-dimer equilibrium.
Figure 4
Figure 4
Proline-scanning mutagenesis. (A) Schematics of the proline-mutant peptides. The light and dark blocks represent oppositely charged heptad repeats. In the uppermost schematics, I, L, and N indicate isoleucine, leucine, and asparagine residues at the H-type sites in the HPPHPPP repeats of the parent sequences. In the remaining schematics, P highlights proline residues that have replaced specific L residues, and all of the other H sites remain unchanged. (B) CD spectra from mixtures of proline variants and parent peptides: p1-Pro1:p2a (■), p1:p2a-Pro4 (•), p1:p2a (○), p1-Pro4:p2a (▵), p1:p2a-Pro1, (▿), and p1-Pro4:p2a-Pro1 (□). (C) Job plot for mixtures of SAF-p1 and SAF-p2a, showing a 1:1 binding stoichiometry. (D) Similar Job plot for mixtures of SAF-p1-pro4 and SAF-p2a-pro1, showing an unaltered binding stoichiometry. In both C and D, the total peptide concentration was kept at 200 μM, and lines are fits to the data as described in the Supporting Material.
Figure 5
Figure 5
Lag phase, seeded growth, and nature of the nucleus. (A) Dependence of kinetics on initial peptide concentration at 65 μM (+), 70 μM (×), 80 μM (), 90 μM (□), 100 μM (■), 120 μM (○), and 140 μM (•) in each peptide. The gray line shows a model fit for the early time points. (B) Fraction completion as a function of time for a seeded sample 80 μM (+); the fit (solid line) is to a single exponential. (C) Fiber growth rate after seeding as a function of initial concentration of peptide. (D) Lag time as a function of the concentration of partially helical dimers (determined from Fig. 3B).
Figure 6
Figure 6
Manipulating SAF length by seeding. Fibers were grown for 1 h from 60 μM samples with (A) 10%, (B) 5%, (C) 2%, and (D) 1% (v/v) of matured fibers from standard 100 μM preparations fragmented after 24 h. Scale bar: 10 μm. (E) Histograms showing the number of fibers as a function of length for the 10% (black) and 1% (gray) seeded samples. (F) Cumulative frequencies for 10% (solid black), 5% (dashed), 2% (dot-dashed), and 1% (gray) seeded samples. Number of observations: 250–1500.

Similar articles

Cited by

References

    1. Woolfson D.N. The design of coiled-coil structures and assemblies. Adv. Protein Chem. 2005;70:79–112. - PubMed
    1. Branco M.C., Schneider J.P. Self-assembling materials for therapeutic delivery. Acta Biomater. 2009;5:817–831. - PMC - PubMed
    1. Yeates T.O., Padilla J.E. Designing supramolecular protein assemblies. Curr. Opin. Struct. Biol. 2002;12:464–470. - PubMed
    1. MacPhee C.E., Woolfson D.N. Engineered and designed peptide-based fibrous biomaterials. Curr. Opin. Solid State Mat. Sci. 2004;8:141–149.
    1. Fairman R., Akerfeldt K.S. Peptides as novel smart materials. Curr. Opin. Struct. Biol. 2005;15:453–463. - PubMed

Publication types

LinkOut - more resources