

Folding intermediate and folding nucleus for I-->N and U-->I-->N transitions in apomyoglobin: contributions by conserved and nonconserved residues
- PMID: 20409491
- PMCID: PMC2856158
- DOI: 10.1016/j.bpj.2009.12.4326
Folding intermediate and folding nucleus for I-->N and U-->I-->N transitions in apomyoglobin: contributions by conserved and nonconserved residues
Abstract
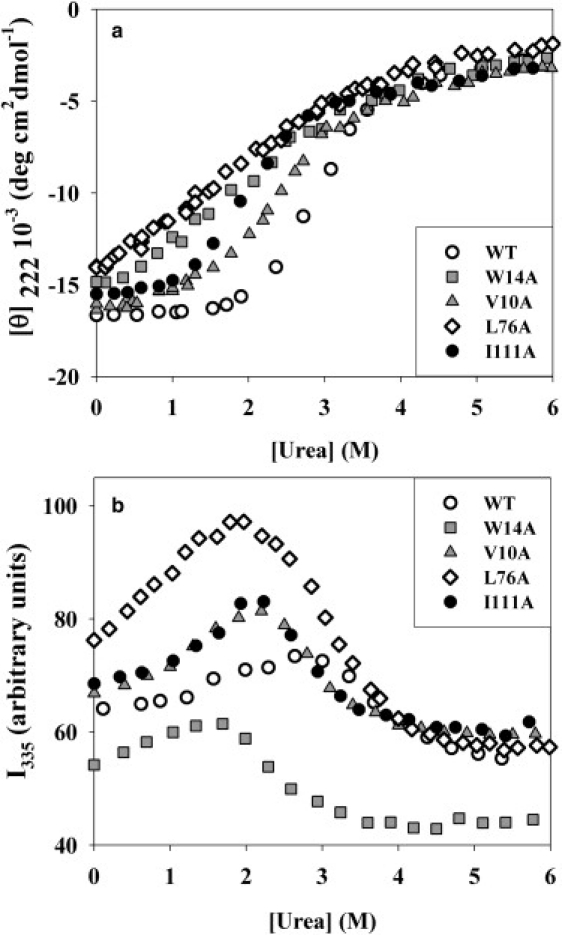
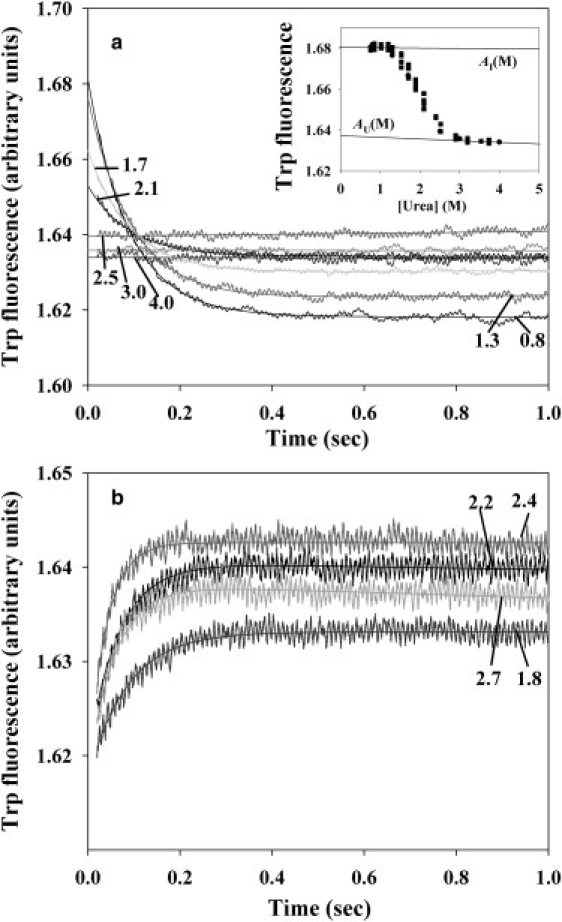
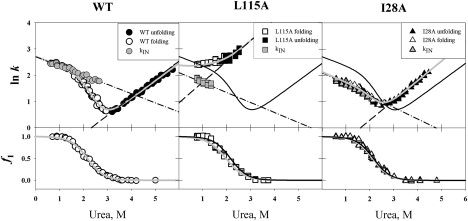
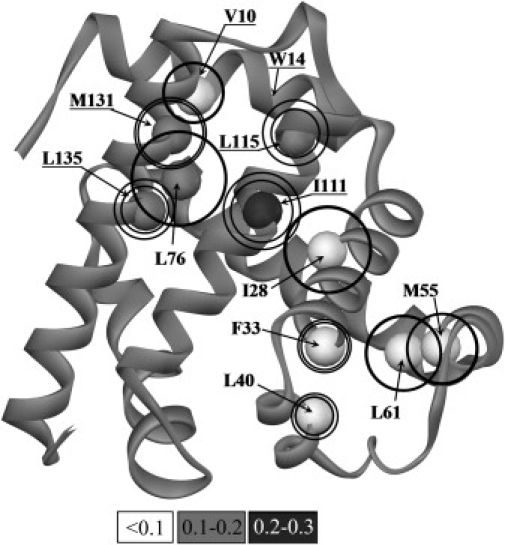
Kinetic investigation on the wild-type apomyoglobin and its 12 mutants with substitutions of hydrophobic residues by Ala was performed using stopped-flow fluorescence. Characteristics of the kinetic intermediate I and the folding nucleus were derived solely from kinetic data, namely, the slow-phase folding rate constants and the burst-phase amplitudes of Trp fluorescence intensity. This allowed us to pioneer the phi-analysis for apomyoglobin. As shown, these mutations drastically destabilized the native state N and produced minor (for conserved residues of G, H helices) or even negligible (for nonconserved residues of B, C, D, E helices) destabilizing effect on the state I. On the other hand, conserved residues of A, G, H helices made a smaller contribution to stability of the folding nucleus at the rate-limiting I-->N transition than nonconserved residues of B, D, E helices. Thus, conserved side chains of the A-, G-, H-residues become involved in the folding nucleus before crossing the main barrier, whereas nonconserved side chains of the B-, D-, E-residues join the nucleus in the course of the I-->N transition.
Copyright 2010 Biophysical Society. Published by Elsevier Inc. All rights reserved.
Figures
Similar articles
-
[On the role of some conserved and nonconserved amino acid residues in transition state and in intermediate of apomyoglobin folding].Mol Biol (Mosk). 2009 Jan-Feb;43(1):136-47. Mol Biol (Mosk). 2009. PMID: 19334536 Russian.
-
Probing the non-native H helix translocation in apomyoglobin folding intermediates.Biochemistry. 2014 Jun 17;53(23):3767-80. doi: 10.1021/bi500478m. Epub 2014 Jun 4. Biochemistry. 2014. PMID: 24857522 Free PMC article.
-
Diffusive motions control the folding and unfolding kinetics of the apomyoglobin pH 4 molten globule intermediate.Biochemistry. 2007 Apr 10;46(14):4379-89. doi: 10.1021/bi602574x. Epub 2007 Mar 17. Biochemistry. 2007. PMID: 17367166
-
Folding of apomyoglobin: Analysis of transient intermediate structure during refolding using quick hydrogen deuterium exchange and NMR.Proc Jpn Acad Ser B Phys Biol Sci. 2017;93(1):10-27. doi: 10.2183/pjab.93.002. Proc Jpn Acad Ser B Phys Biol Sci. 2017. PMID: 28077807 Free PMC article. Review.
-
Formation of the Native Topology of a Protein is due to the "Conserved but Non-Functional" Residues: A Case of Apomyoglobin Folding.Front Biosci (Landmark Ed). 2024 Nov 8;29(11):379. doi: 10.31083/j.fbl2911379. Front Biosci (Landmark Ed). 2024. PMID: 39614442 Review.
Cited by
-
Microsecond folding dynamics of apomyoglobin at acidic pH.J Phys Chem B. 2012 Jun 14;116(23):7014-25. doi: 10.1021/jp3012365. Epub 2012 Apr 17. J Phys Chem B. 2012. PMID: 22475221 Free PMC article.
-
Complex Folding Landscape of Apomyoglobin at Acidic pH Revealed by Ultrafast Kinetic Analysis of Core Mutants.J Phys Chem B. 2018 Dec 13;122(49):11228-11239. doi: 10.1021/acs.jpcb.8b06895. Epub 2018 Aug 31. J Phys Chem B. 2018. PMID: 30133301 Free PMC article.
-
Evidence for a Shared Mechanism in the Formation of Urea-Induced Kinetic and Equilibrium Intermediates of Horse Apomyoglobin from Ultrarapid Mixing Experiments.PLoS One. 2015 Aug 5;10(8):e0134238. doi: 10.1371/journal.pone.0134238. eCollection 2015. PLoS One. 2015. PMID: 26244984 Free PMC article.
-
Location trumps length: polyglutamine-mediated changes in folding and aggregation of a host protein.Biophys J. 2011 Jun 8;100(11):2773-82. doi: 10.1016/j.bpj.2011.04.028. Biophys J. 2011. PMID: 21641323 Free PMC article.
-
Some useful ideas for multistate protein design: Effect of amino acid substitutions on the multistate proteins stability and the rate of protein structure formation.Front Mol Biosci. 2022 Aug 26;9:983009. doi: 10.3389/fmolb.2022.983009. eCollection 2022. Front Mol Biosci. 2022. PMID: 36090043 Free PMC article.
References
-
- Matouschek A., Kellis J.T., Fersht A.R. Mapping the transition state and pathway of protein folding by protein engineering. Nature. 1989;340:122–126. - PubMed
-
- Matouschek A., Kellis J.T., Fersht A.R. Transient folding intermediates characterized by protein engineering. Nature. 1990;346:440–445. - PubMed
-
- Itzhaki L.S., Otzen D.E., Fersht A.R. The structure of the transition state for folding of chymotrypsin inhibitor 2 analyzed by protein engineering methods: evidence for a nucleation-condensation mechanism for protein folding. J. Mol. Biol. 1995;254:260–288. - PubMed
-
- Fulton K.F., Main E.R., Jackson S.E. Mapping the interactions present in the transition state for unfolding/folding of FKBP12. J. Mol. Biol. 1999;291:445–461. - PubMed
-
- Chiti F., Taddei N., Dobson C.M. Mutational analysis of acylphosphatase suggests the importance of topology and contact order in protein folding. Nat. Struct. Biol. 1999;6:1005–1009. - PubMed
Publication types
MeSH terms
Substances
Grants and funding
LinkOut - more resources
Full Text Sources
Research Materials
