

Spatial structure and diffusive dynamics from single-particle trajectories using spline analysis
- PMID: 20409493
- PMCID: PMC2856136
- DOI: 10.1016/j.bpj.2009.12.4299
Spatial structure and diffusive dynamics from single-particle trajectories using spline analysis
Abstract
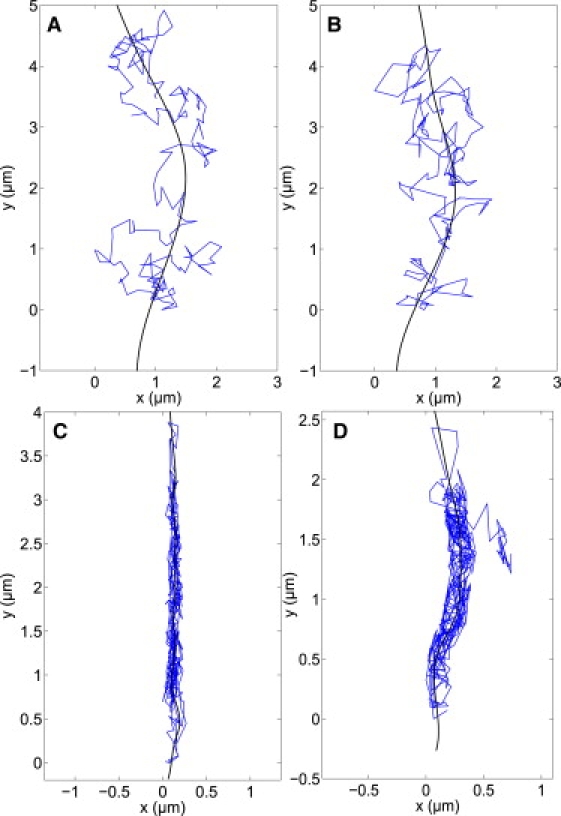
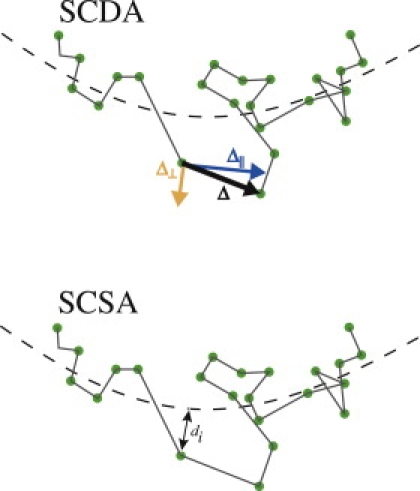
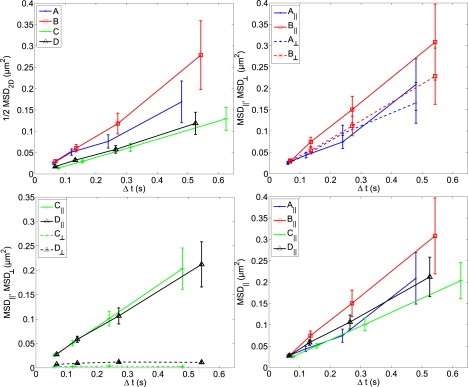
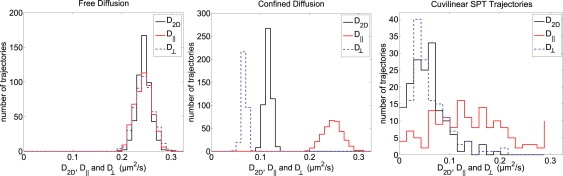
Single-particle tracking of biomolecular probes has provided a wealth of information about intracellular trafficking and the dynamics of proteins and lipids in the cell membrane. Conventional mean-square displacement (MSD) analysis of single-particle trajectories often assumes that probes are moving in a uniform environment. However, the observed two-dimensional motion of probe particles is influenced by the local three-dimensional geometry of the cell membrane and intracellular structures, which are rarely flat at the submicron scale. This complex geometry can lead to spatially confined trajectories that are difficult to analyze and interpret using conventional two-dimensional MSD analysis. Here we present two methods to analyze spatially confined trajectories: spline-curve dynamics analysis, which extends conventional MSD analysis to measure diffusive motion in confined trajectories; and spline-curve spatial analysis, which measures spatial structures smaller than the limits of optical resolution. We show, using simulated random walks and experimental trajectories of quantum dot probes, that differences in measured two-dimensional diffusion coefficients do not always reflect differences in underlying diffusive dynamics, but can instead be due to differences in confinement geometries of cellular structures.
Copyright 2010 Biophysical Society. Published by Elsevier Inc. All rights reserved.
Figures
Similar articles
-
Quantitative analysis of single particle trajectories: mean maximal excursion method.Biophys J. 2010 Apr 7;98(7):1364-72. doi: 10.1016/j.bpj.2009.12.4282. Biophys J. 2010. PMID: 20371337 Free PMC article.
-
Single particle tracking of complex diffusion in membranes: simulation and detection of barrier, raft, and interaction phenomena.J Phys Chem B. 2007 Apr 12;111(14):3625-32. doi: 10.1021/jp067187m. Epub 2007 Mar 17. J Phys Chem B. 2007. PMID: 17388520
-
Time series analysis of particle tracking data for molecular motion on the cell membrane.Bull Math Biol. 2009 Nov;71(8):1967-2024. doi: 10.1007/s11538-009-9434-6. Epub 2009 Aug 6. Bull Math Biol. 2009. PMID: 19657701 Free PMC article.
-
Mechanisms underlying anomalous diffusion in the plasma membrane.Curr Top Membr. 2015;75:167-207. doi: 10.1016/bs.ctm.2015.03.002. Epub 2015 Apr 15. Curr Top Membr. 2015. PMID: 26015283 Review.
-
Anomalous transport in the crowded world of biological cells.Rep Prog Phys. 2013 Apr;76(4):046602. doi: 10.1088/0034-4885/76/4/046602. Epub 2013 Mar 12. Rep Prog Phys. 2013. PMID: 23481518 Review.
Cited by
-
Lateral diffusion on tubular membranes: quantification of measurements bias.PLoS One. 2011;6(9):e25731. doi: 10.1371/journal.pone.0025731. Epub 2011 Sep 29. PLoS One. 2011. PMID: 21980531 Free PMC article.
-
Cytoskeletal control of CD36 diffusion promotes its receptor and signaling function.Cell. 2011 Aug 19;146(4):593-606. doi: 10.1016/j.cell.2011.06.049. Cell. 2011. PMID: 21854984 Free PMC article.
References
-
- Saxton M.J., Jacobson K. Single-particle tracking: applications to membrane dynamics. Annu. Rev. Biophys. Biomol. Struct. 1997;26:373–399. - PubMed
-
- Inoue A., Okabe S. The dynamic organization of postsynaptic proteins: translocating molecules regulate synaptic function. Curr. Opin. Neurobiol. 2003;13:332–340. - PubMed
-
- Wieser S., Schütz G.J. Tracking single molecules in the live cell plasma membrane—do's and don't's. Methods. 2008;46:131–140. - PubMed
-
- Levi V., Gratton E. Exploring dynamics in living cells by tracking single particles. Cell Biochem. Biophys. 2007;48:1–15. - PubMed
MeSH terms
Substances
Grants and funding
LinkOut - more resources
Full Text Sources
