

Brain plasticity and intellectual ability are influenced by shared genes
- PMID: 20410105
- PMCID: PMC6632359
- DOI: 10.1523/JNEUROSCI.5841-09.2010
Brain plasticity and intellectual ability are influenced by shared genes
Abstract
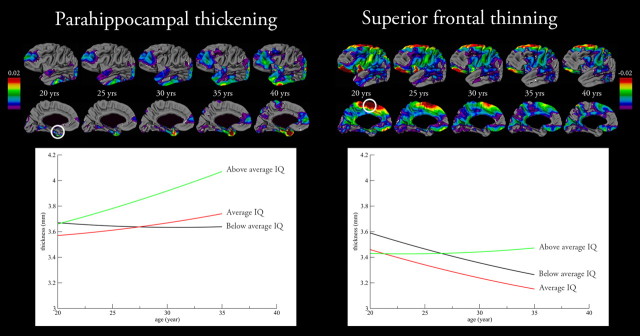
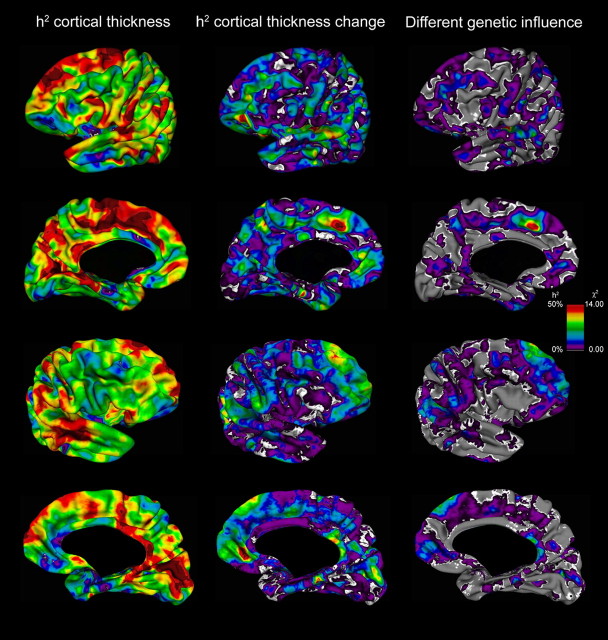
Although the adult brain is considered to be fully developed and stable until senescence when its size steadily decreases, such stability seems at odds with continued human (intellectual) development throughout life. Moreover, although variation in human brain size is highly heritable, we do not know the extent to which genes contribute to individual differences in brain plasticity. In this longitudinal magnetic resonance imaging study in twins, we report considerable thinning of the frontal cortex and thickening of the medial temporal cortex with increasing age and find this change to be heritable and partly related to cognitive ability. Specifically, adults with higher intelligence show attenuated cortical thinning and more pronounced cortical thickening over time than do subjects with average or below average IQ. Genes influencing variability in both intelligence and brain plasticity partly drive these associations. Thus, not only does the brain continue to change well into adulthood, these changes are functionally relevant because they are related to intelligence.
Figures
References
-
- Andreasen NC, Flaum M, Arndt S. The Comprehensive Assessment of Symptoms and History (CASH): an instrument for assessing diagnosis and psychopathology. Arch Gen Psychiatry. 1992;49:615–623. - PubMed
-
- Baaré WFC, Hulshoff Pol HE, Boomsma DI, Posthuma D, de Geus EJ, Schnack HG, van Haren NEM, van Oel CJ, Kahn RS. Quantative genetic modeling of variation in human brain morphology. Cereb Cortex. 2001;11:816–824. - PubMed
-
- Boomsma DI. Netherlands twin register. Amsterdam: Vrije Universiteit; 2010. Available at www.tweelingenregister.org/index_uk.html.
-
- Boomsma DI, Busjahn A, Peltonen L. Classical twin studies and beyond. Nat Rev Genet. 2002;3:872–882. - PubMed
-
- Brans RGH, van Haren NEM, van Baal GCM, Schnack HG, Kahn RS, Hulshoff Pol HE. Heritability of changes in brain volume over time in twin pairs discordant for schizophrenia. Arch Gen Psychiatry. 2008;65:1259–1268. - PubMed
Publication types
MeSH terms
LinkOut - more resources
Full Text Sources