Comparative Study
. 2010 Apr 21;30(16):5569-78.
doi: 10.1523/JNEUROSCI.4781-09.2010.

Cotrafficking of SV2 and synaptotagmin at the synapse

Affiliations
Comparative Study

Cotrafficking of SV2 and synaptotagmin at the synapse

Jia Yao et al. J Neurosci. .

Abstract

Synaptic vesicles are specialized cycling endosomes that contain a unique constellation of membrane proteins. Proteins are sorted to vesicles by short amino acid sequences that serve as binding sites for clathrin adaptor proteins. Here we show that a tyrosine-based endocytosis motif in the vesicle protein SV2 is required for trafficking to synaptic vesicles of both SV2 and the calcium sensor protein synaptotagmin. Aberrant neurotransmission in cultured hippocampal neurons lacking SV2 was rescued by expression of wild-type SV2A, but not by SV2A-Y46A, a mutant containing a disrupted endocytosis motif in SV2A's cytoplasmic N terminus. Neurons expressing SV2A-Y46A had significantly more SV2 on the plasma membrane, indicating reduced internalization. A screen for proteins that preferentially bound wild-type SV2A identified multiple endocytosis-related proteins, and in vitro binding studies confirmed binding to the clathrin adaptors AP2, EPS15, and amphiphysin 2/Bin1. Neurons lacking SV2 contained less synaptotagmin and had a higher proportion of synaptotagmin on the plasma membrane. Expression of either wild-type SV2A or SV2A-Y46A restored synaptotagmin expression levels; however, only wild-type SV2A restored a normal proportion of synaptotagmin on the plasma membrane. These findings indicate that SV2 influences the expression and trafficking of synaptotagmin via separate mechanisms. Synaptic vesicles immunoisolated from SV2A/B double knock-out mice had significantly less synaptotagmin than vesicles isolated from wild-type mice. Our results indicate that SV2 plays a major role in regulating the amount of synaptotagmin in synaptic vesicles and provide an explanation for the observation that synapses lacking SV2 have fewer vesicles competent for calcium-induced fusion.


Figures

Figure 1.
Figure 1.
Expression of SV2A-EGFP fusion proteins in hippocampal neurons from SV2A/B DKO mice. a, Schematic of SV2A showing, with red asterisks, the location of two tyrosine-based endocytosis motifs. N and C denote the N and C termini, respectively. b, SV2A and SV2A-Y46A colocalize with synaptophysin. Hippocampal neurons from SV2A/B DKO mice were cultured on microislands and infected with lentivirus encoding the indicated SV2A-EGFP protein. Neurons were labeled with anti-SV2A polyclonal and anti-synaptophysin monoclonal antibodies. Antibody binding was visualized with goat-anti-rabbit Alexa-Fluor 488 (green) and goat-anti-mouse Alexa-Fluor 568 (red). Shown are images collected with a confocal microscope. SV2A-EGFP and SV2A-Y46A-EGFP produced punctate labeling (A, D) that colocalized with synaptophysin labeling (B, E). The yellow signal in C and F indicates colocalization of the SV2A and synaptophysin labeling. In contrast, SV2A-Y443A (G) and SV2A-Y46A/Y443A (J) were diffusively distributed in the neurons and did not colocalize with synaptophysin (H, I, K, and L). Scale bar, 10 μm. c, SV2A and SV2A-Y46A are expressed at comparable levels. Shown is a representative Western blot analysis of conventional cultures expressing the indicated SV2A construct or EGFP. Blots were probed for SV2A and actin (as a loading control). SV2 net intensity was normalized to the net intensity of actin. On average, SV2A-Y46A was expressed at ∼80% the levels of wild-type SV2A.
Figure 2.
Figure 2.
SV2A-EGFP but not SV2A-Y46A-EGFP restores normal neurotransmission to neurons from SV2A/B DKO mice. Autaptic hippocampal neurons cultured from SV2A/B DKO mice were infected with lentivirus encoding EGFP, SV2A-EGFP, or SV2A-Y46A-EGFP and analyzed for features of the SV2 knock-out phenotype using whole-cell voltage-clamp recordings. Error bars represent SEM. a, b, SV2A but not SV2A-Y46A increases EPSC magnitude. Shown are average EPSC amplitudes (a) and total charge transfer (b) recorded from neurons expressing the indicated construct. The number of cells analyzed is indicated within the bars. The average EPSC amplitude and total charge transfer in neurons expressing SV2A were significantly larger than in neurons expressing either EGFP or SV2A-Y46A-EGFP as determined by Student's t test (unpaired, two tailed). *p < 0.05; **p < 0.01. For EPSC amplitudes: EGFP versus wild type (WT), p = 0.0008; Y46A versus EGFP, p = 0.329; Y46A versus WT, p = 0.016. For total charge transfer: EGFP versus WT, p = 0.0006; Y46A versus EGFP, p = 0.266; Y46A versus WT, p = 0.017. c, SV2A but not SV2A-Y46A restores paired-pulse depression. The EPSC amplitude in response to two stimuli separated by 45 msec was expressed as the ratio of the second to the first response. Data were evaluated using Student's t test (unpaired, two-tailed). **p < 0.01. For EGFP versus WT, p = 0.0005; for Y46A versus EGFP, p = 0.074; for Y46A versus WT, p = 0.00003. d, SV2A but not SV2A-Y46A restores synaptic depression in response to stimulus trains. Shown are averaged normalized responses to 10 Hz (left) or 20 Hz (right) stimulus trains. EPSC amplitudes were normalized to the first response in the train. The number of cells analyzed is indicated in the parentheses.
Figure 3.
Figure 3.
Reduced endocytosis of SV2A-Y46A. The proportion of SV2 on the plasma membrane (p.m.) was measured by surface biotinylation followed by immunoprecipitation with an anti-SV2A antibody. Immunoprecipitated material was analyzed by Western blot for both SV2 and biotin content. The top panel shows a representative blot series. The ratio of biotin to SV2 was calculated for each lane and normalized to the ratio obtained from neurons expressing wild-type SV2A in the same blot. Student's t test was used for statistical analysis of the data. The error bars represent SEM (n = 3). *p < 0.05;. For SV2A immunoprecipitated samples, for Y46A versus wild type, p = 0.033.
Figure 4.
Figure 4.
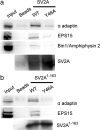
The Y46A mutation disrupts SV2A binding to endocytosis-related proteins. a, Decreased binding of the adaptor proteins AP2 (α adaptin), EPS15, and amphiphysin 2 (Bin1) to SV2A-Y46A. SV2A-FLAG was generated in HEK293 fibroblasts and purified with anti-FLAG affinity resin. Beads were incubated with a Triton X-100 extract of mouse brain, after which bound proteins were identified by Western blot. When compared to wild-type SV2A, SV2A-Y46A demonstrated decreased binding to all three proteins. The blot shown is representative of three independent experiments. b, Decreased binding of the adaptor proteins AP2 (α adaptin) and EPS15 to the N terminus of SV2A-Y46A. A binding assay as in a performed with SV2A1-163-FLAG fusion proteins is shown. In this case, the Y46A mutant demonstrated decreased binding to AP2 (α adaptin) and EPS15. The blot shown is representative of six independent experiments.
Figure 5.
Figure 5.
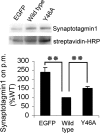
Reduced endocytosis of synaptotagmin 1 in neurons expressing SV2A-Y46A. The proportion of synaptotagmin on the plasma membrane was measured by surface biotinylation followed by immunoprecipitation with an anti-synaptotagmin 1 antibody. Immunoprecipitated material was analyzed by Western blot for both synaptotagmin and biotin content. The top panel shows a representative blot series. The ratio of biotin to synaptotagmin was calculated for each lane and normalized to the ratio obtained from neurons expressing wild-type (WT) SV2A in the same blot. Student's t test was used for statistical analysis of the data. The error bars represent SEM (n = 6). **p < 0.01. For EGFP versus WT, p = 0.004; for Y46A versus WT, p = 0.003. Expression of both SV2 proteins decreased biotinylation of synaptotagmin, but SV2A-Y46A did so to a lesser degree than wild-type SV2.
Figure 6.
Figure 6.
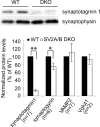
Synaptic vesicles from SV2A/B DKO mice have less synaptotagmin. Synaptic vesicles were prepared from wild-type (WT) or SV2A/B DKO mice by density centrifugation followed with anti-synaptophysin immunoisolation. Immunoisolated synaptic vesicles were analyzed by Western blot for synaptotagmin 1, synaptogyrin, synaptobrevin/VAMP2, Vglut1, and synaptophysin. Top, A representative blot, containing duplicate samples of vesicles from WT and DKO mice, detected by anti-synaptotagmin 1 and synaptophysin antibodies. Bottom, Average protein to synaptophysin ratio for the indicated proteins. Data were analyzed by Student's t test (unpaired, two-tailed). The number of times each study was replicated (n) is indicated for each protein. The error bars represent SEM. *p < 0.05; **p < 0.01.
Figure 7.
Figure 7.
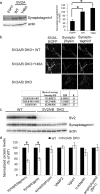
Expression of SV2 affects synaptotagmin expression. a, Synaptotagmin expression is significantly reduced in neurons cultured from SV2A/B DKO mice. Shown is a representative Western blot of cultured hippocampal neurons from SV2A/B DKO mice expressing the indicated SV2A protein. Cell extracts were probed with anti-synaptotagmin 1 and anti-actin, which served as a loading control. For each lane, the net intensity of synaptotagmin 1 to actin was expressed as a ratio, and the average ratio for wild-type (WT) SV2A was set to 100%. Ratios for other lanes within the same blot were then normalized to that value. The graph on the right represents data from four experiments. *p < 0.05 by Student's t test. For EGFP versus WT, p = 0.01; for Y46A versus EGFP, p = 0.02; for Y46A versus WT, p = 0.348. b, Synaptotagmin expression is significantly reduced in the synapses of neurons cultured from SV2A/B DKO mice. To measure synaptic levels of synaptotagmin, we performed immunolabeling of cultured neurons using anti-synaptophysin to identify synapses. Representative images at the top demonstrate decreased synaptotagmin 1 levels in the synapses of neurons from SV2A/B DKO mice. Expression of both wild-type SV2A and SV2A-Y46A increased synaptotagmin 1 levels. The table lists the mean average synaptotagmin labeling intensity from two independent experiments. Data were analyzed by Student's t test (unpaired, two-tailed). For DKO versus DKO+WT, p < 0.00001; for DKO versus DKO+Y46A, p < 0.00001. N indicates the total number of images analyzed for each condition. AU, Arbitrary unit. c, Synaptotagmin expression is significantly reduced in SV2A/B DKO mouse brain. Shown is a Western blot of postnuclear supernatants (PNSs) from the brains of six wild-type and six SV2A/B DKO mice that was probed for SV2, synaptotagmin 1, and actin. The ratio of anti-synaptotagmin 1 to anti-actin was calculated for each lane and graphed in d. The residual anti-SV2 labeling in the DKO samples represents SV2C. d, SV2 selectively affects the expression of synaptotagmin and synaptogyrin in brain. Brain PNSs from six wild-type and six SV2A/B DKO mice were probed for synaptotagmin 1, synaptogyrin, synaptophysin, VAMP2, and Vglut1. Brain PNSs from four wild-type and seven SV2A/B DKO mice were probed for AP2 (α adaptin) and amphiphysin 2 (Bin1). Actin content was assessed as a loading control for each sample. The ratio of query protein to actin was calculated for each lane, averaged, and graphed. Data were analyzed by Student's t test (unpaired, two-tailed). The error bars represent SEM. *p < 0.05.
Figure 8.
Figure 8.
The Y46A mutation affects synaptotagmin binding to the N terminus of SV2A but not to full-length SV2A. Top, The Y46A mutation does not impact binding of synaptotagmin to full-length SV2A. In vitro binding assays were performed as in Figure 4 using full-length SV2A-FLAG or SV2-Y46A-FLAG adsorbed to anti-FLAG resin. Resins were incubated with a Triton X-100 extract of mouse brain, after which associated proteins were identified by Western blot analysis. When compared to wild-type SV2A, SV2A-Y46A demonstrated similar binding to synaptotagmin. A representative blot from three independent experiments is shown. Bottom, An in vitro binding assay was performed with SV2A1-163-FLAG fusion proteins. In this case, the Y46A mutant demonstrated decreased binding to synaptotagmin. The blot shown is representative of six independent experiments.
Figure 9.
Figure 9.
Mutation of the first endocytosis motif in SV2A results in a minimal change in synaptic endocytosis. a, Representative images of the membrane dye FM 4-64 (red) in neurons expressing EGFP or SV2A-Y46A-EGFP (green) after a 1 min depolarization. Scale bar, 10 μm. b, Quantification of FM 4-64 fluorescence intensity in SV2-positive puncta. Shown are the average fluorescence intensity values, and values normalized to wild type within the same experiment. Data were analyzed by Student's t test (unpaired, two-tailed). The data are from five experiments. N indicates the total number of images analyzed for each condition. AU, Arbitrary unit. There was a small decrease in FM 4-64 uptake in neurons expressing SV2A-Y46A.

Similar articles

Cited by

References

    1. Bajjalieh SM, Franz G, Weimann JM, McConnell SK, Scheller RH. Differential expression of synaptic vesicle protein 2 (SV2) isoforms. J Neurosci. 1994;14:5223–5235. - PMC - PubMed
    1. Bennett MK, Calakos N, Kreiner T, Scheller RH. Synaptic vesicle membrane proteins interact to form a multimeric complex. J Cell Biol. 1992;116:761–775. - PMC - PubMed
    1. Brinkmann MM, Spooner E, Hoebe K, Beutler B, Ploegh HL, Kim YM. The interaction between the ER membrane protein UNC93B and TLR3, 7, and 9 is crucial for TLR signaling. J Cell Biol. 2007;177:265–275. - PMC - PubMed
    1. Bushara KO, Malik T, Exconde RE. The effect of levetiracetam on essential tremor. Neurology. 2005;64:1078–1080. - PubMed
    1. Chang WP, Sudhof TC. SV2 renders primed synaptic vesicles competent for Ca2+-induced exocytosis. J Neurosci. 2009;29:883–897. - PMC - PubMed

Publication types

MeSH terms