Comparative Study
. 2010 Apr 21;30(16):5590-602.
doi: 10.1523/JNEUROSCI.5837-09.2010.

Fgfr2 is required for the development of the medial prefrontal cortex and its connections with limbic circuits

Affiliations
Comparative Study

Fgfr2 is required for the development of the medial prefrontal cortex and its connections with limbic circuits

Hanna E Stevens et al. J Neurosci. .

Abstract

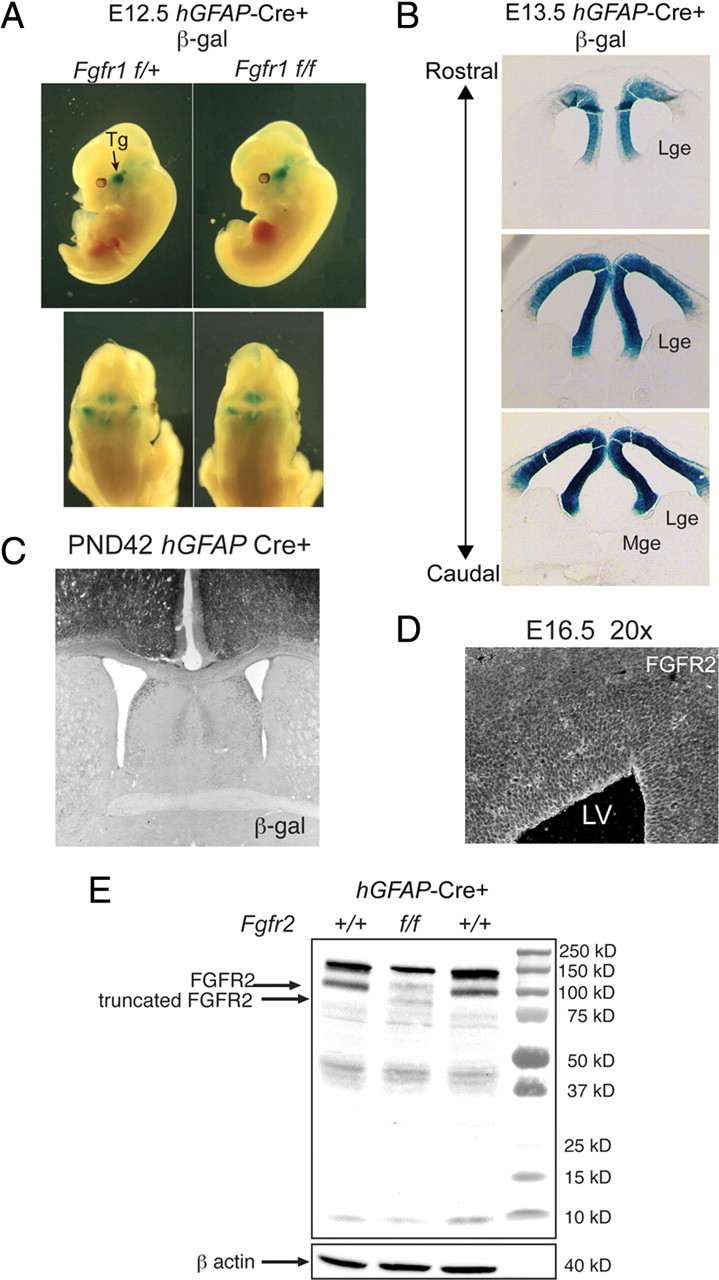
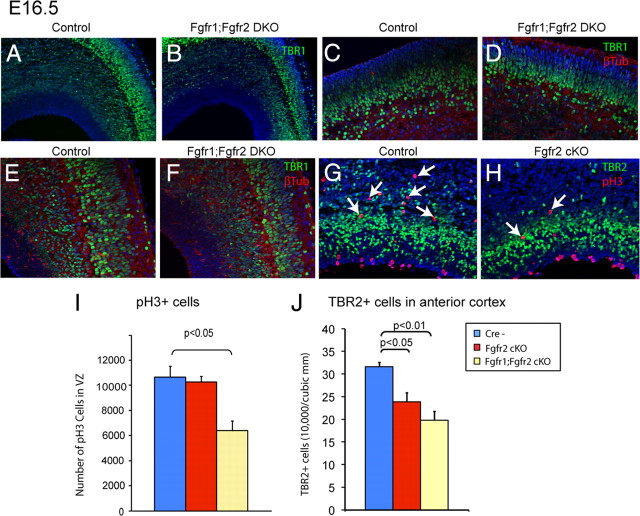
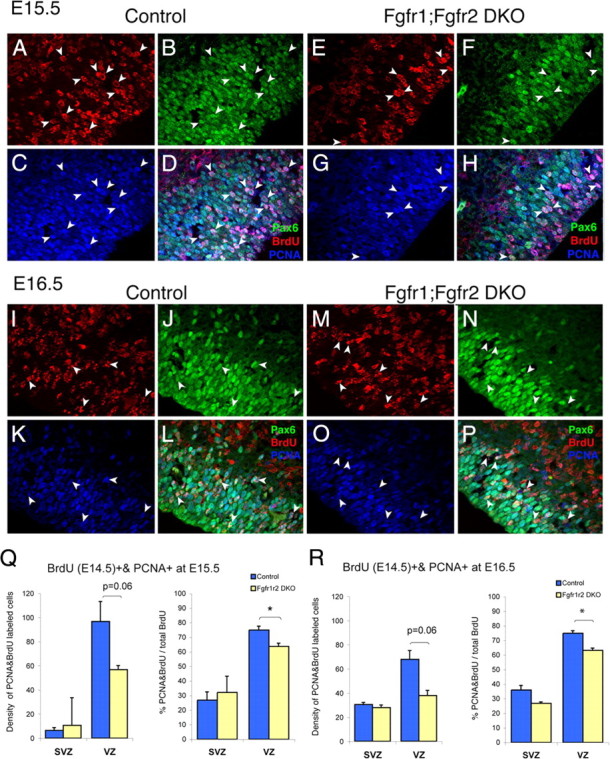
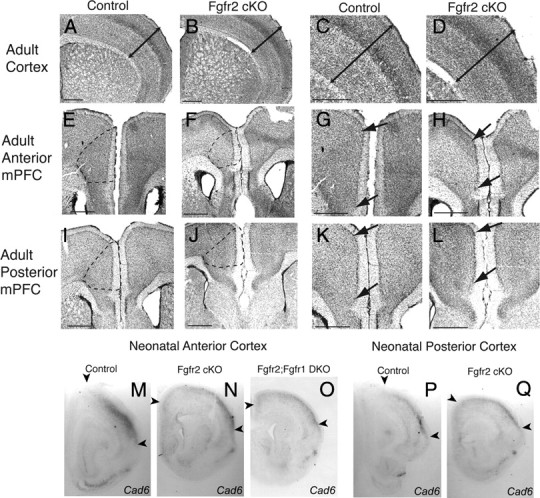
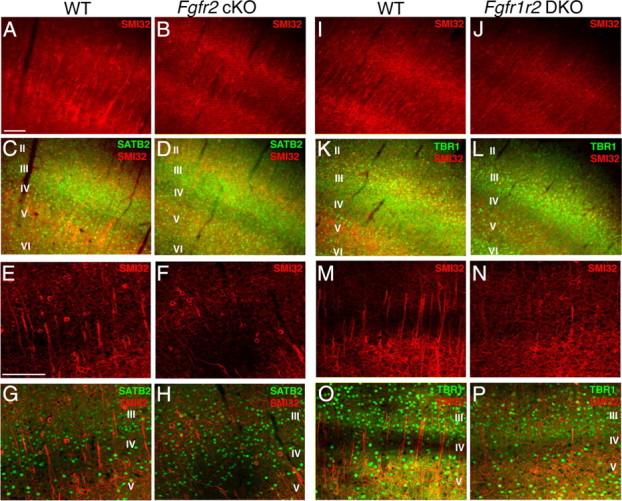
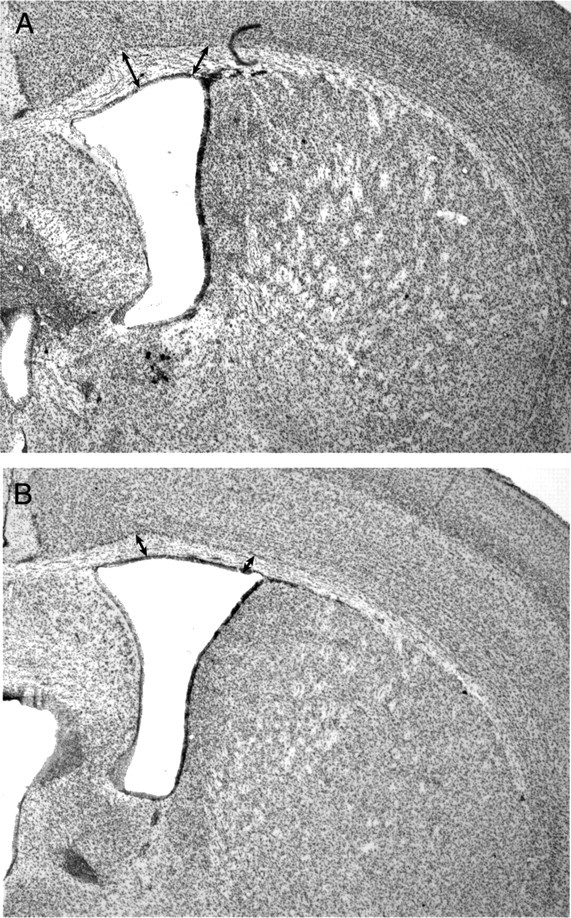
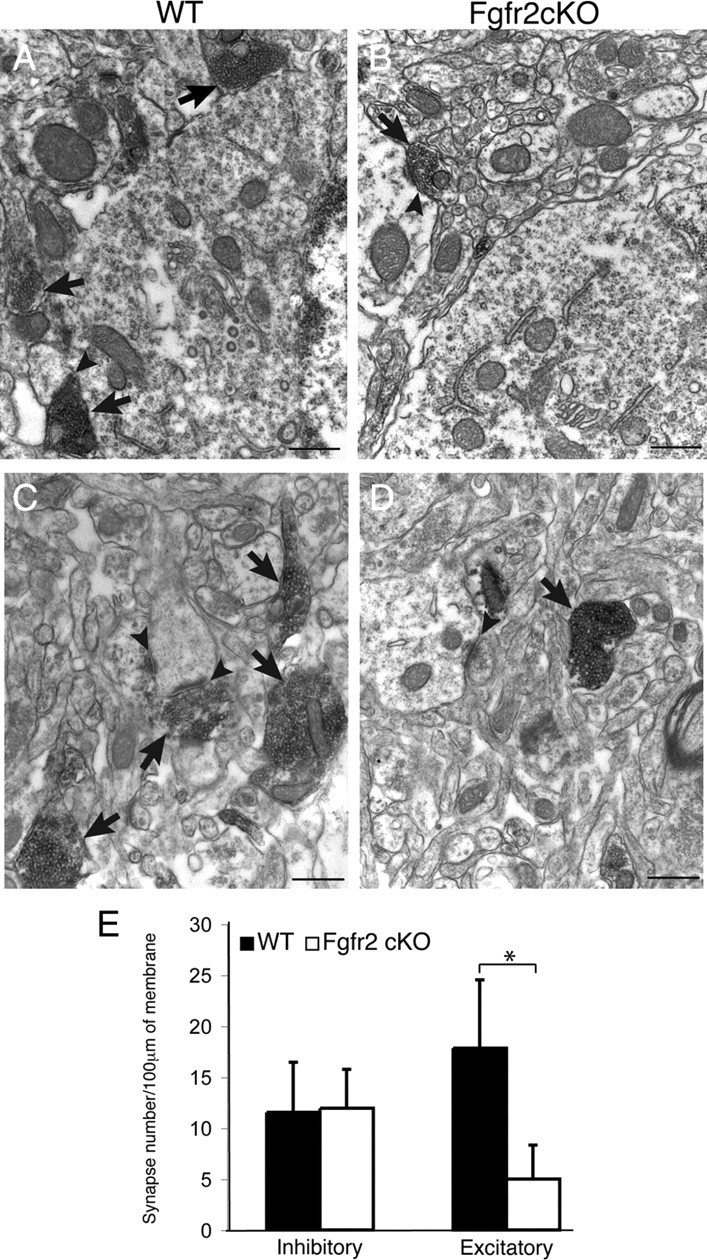
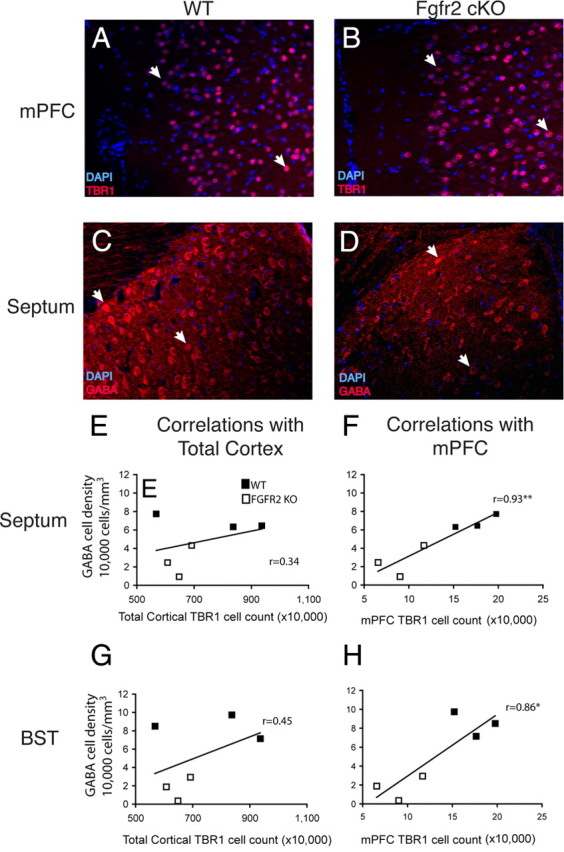
To understand the role of specific fibroblast growth factor receptors (FGFRs) in cortical development, we conditionally inactivated Fgfr2 or both Fgfr1 and Fgfr2 [Fgfr2 conditional knock-out (cKO) or double knock-out mice, respectively] in radial glial cells of the dorsal telencephalon. Fgfr1 and Fgfr2 are necessary for the attainment of a normal number of excitatory neurons in the cerebral cortex. The action of FGF receptors appears to be through increasing self-renewal of neuronal precursors within the ventricular zone. Volume measurements, assessments of excitatory neuron number, and areal marker expression suggested that the proper formation of the medial prefrontal cortex (mPFC) depends on the function of Fgfr2, whereas Fgfr1 together with Fgfr2 control excitatory cortical neuron development within the entire cerebral cortex. Fgfr2 cKO mice had fewer and smaller glutamate synaptic terminals in the bed nuclei of the stria terminalis (BST), a projection area for mPFC cortical neurons. Furthermore, Fgfr2 cKO mice showed secondary decreases in GABAergic neurons in the BST and septum. These data demonstrate that FGFR2 signaling expands the number of excitatory neurons in the mPFC and secondarily influences target neurons in subcortical stations of the limbic system.


Figures

Figure 1.
Figure 1.
General characteristics of Fgfr2 cKOGFAP-Cre and Fgfr1;Fgfr2 cKOGFAP-Cre mice. A–C, Cre-recombination driven conditional KO of Fgfr2 as demonstrated by β-galactosidase reporter expression was not present before E13.5 (A) and was localized to the dorsal telencephalon embryonically (B) and in a 6-week-old animal (C). D, Immunohistochemistry for FGFR2 in E15.5 dorsal telencephalon. E, Western blot analysis of the cerebral cortex of Fgfr2 cKO compared with 2-month-old control littermates showing reduced amount of FGFR2, which migrates with an apparent molecular weight of 100 kDa, and the expression of an additional protein of ∼90 kDa representing the truncated mutant protein. Tg, Trigeminal ganglion; β-gal, β-galactosidase; GE, ganglionic eminences.
Figure 2.
Figure 2.
Decrease in TBR1+ neurons and proliferating progenitors in cortex of Fgfr1;Fgfr2 DKO mice. A–F, TBR1 immunostaining showing lower density of TBR1+ cells in the cerebral cortex of Fgfr1;Fgfr2 DKO mice with similar deficits in both anteromedial (A, B, 10×; E, F, 20×) and dorsolateral regions (C, D, 20×). G, H, TBR2 (green) and pH3 (red) double immunostaining, showing fewer TBR2+ and pH3+ cells in the SVZ/intermediate zone of Fgfr2 cKO mice. I, Average density (±SEM) of pH3+ cells at E16.5 by optical fractionator, corrected for measured section thickness within the VZ (n = 5 control, 3 Fgfr2 cKO, and 2 Fgfr1;Fgfr2 DKO). J, Average (±SEM) density of TBR2+ cells by optical fractionator at E16.5, corrected for measured section thickness, showing significantly reduced density in both mutant lines in the anterior cortical wall (n = 5 control, 3 Fgfr2 cKO, and 2 Fgfr1;Fgfr2 DKO).
Figure 3.
Figure 3.
Decrease in size of VZ and number and proportion of proliferating cells reentering the cell cycle in Fgfr1;Fgfr2 DKO mice at E15.5 (A–H, Q) and E16.5 (I–P, R). A–P, PCNA, BrdU, Pax6 triple immunostaining in E15.5 (A–H) and E16.5 (I–P) dorsolateral cortex, showing reduced thickness of Pax6+ cells defining VZ and reduced number of PCNA/BrdU double-labeled cells in VZ. Q, R, Average (±SEM) density (cells/counting box measuring 7.0 × 104 μm3) and proportion of PCNA/BrdU double-labeled cells, showing significant deficits in VZ at both E15.5 and E16.5 (*p < 0.05). ANOVA, Main effect of genotype significant only in VZ (F(1,9) = 24.83; p = 0.002). There was no significant day by genotype interaction.
Figure 4.
Figure 4.
Decrease in adult (three-month-old) neocortical and mPFC volume in Fgfr2 cKO and Fgfr1;Fgfr2 DKO mice and neonatal (postnatal day 0) expression of areal markers in cerebral cortex. A–D, Cresyl violet staining demonstrating decrease in circumferential and thickness (as indicated by arrows) dimensions of the neocortex in an Fgfr2 cKO mouse (B, D) compared with a Cre− control animal (A, C). E, F, I, J, Cresyl violet staining demonstrating representative boundaries (broken lines) used to define medial prefrontal cortex and the significant decrease in size in an Fgfr2 cKO animal (F, J) compared with a control (E, I). G, H, K, L, Higher magnification of images from E, F, I, and J. Dorsal and ventral boundaries of mPFC are shown (arrows) as defined by cytoarchitectonic changes in layers II and V (top arrow marking end of gradual decrease in density of cells from mPFC to precentral cortex; bottom arrow marking decrease in evenness of layer II cells from mPFC to infralimbic cortex). M–Q, In situ hybridization for Cadherin 6 in PO brain demonstrating medially shifted distribution of expression in Fgfr2 cKO (N, Q) and Fgfr1;Fgfr2 DKO (O) mice compared with a control littermate (M, P). Scale bar, 500 μm.
Figure 5.
Figure 5.
Excitatory neurons decreased in neocortex of Fgfr2 cKO and Fgfr1;Fgfr2 DKO mice compared with controls at 3 months of age. SMI-32 immunostaining showing reduced pyramidal cell number in the neocortex of Fgfr2 cKO (A–H) and DKO (I–P) animals. C, D, G, H, Relative thickness of cortical layers shown with SATB2 and SMI-32 double staining was similar in control and Fgfr2 cKO animals. K, L, O, P, TBR1+ cells were decreased in a Fgfr1;Fgfr2 DKO animals, with greater reductions in upper layers. Scale bar, 100 μm.
Figure 6.
Figure 6.
Decrease in cortical white matter volume in 3-month-old Fgfr2 cKO mice. A, B, Cresyl violet staining demonstrating decrease in thickness (as indicated by arrows) of cortical white matter in Fgfr2 cKO mice (B) compared with a Cre− control animal (A).
Figure 7.
Figure 7.
Subcortical projections of mPFC are decreased in 3-month-old Fgfr2 cKO animals. A–D, Electron micrographs of vGlut2 focused on cell bodies (A, B) and axons (C, D) preembedding immunocytochemistry, demonstrating reduced density and size of projections (arrows) and synapses (arrowheads) in the BST of Fgfr2 cKO animals (B, D) compared with Cre− controls (A, C). Scale bars, 1 μm. E, Quantification of inhibitory and excitatory synapse density in BST (n = 3, 3) demonstrating no decrease in inhibitory synapses but significant decrease in excitatory synapses (*p < 0.05) in Fgfr2 cKO animals compared with Cre− controls. Error bars indicate SEM.
Figure 8.
Figure 8.
Correlations of TBR1+ cell number in mPFC and density of GABA+ cell density in subcortical septum and BST in 3-month-old mice. A, B, TBR1 immunostaining showing reduced cell number in mPFC of a Fgfr2 cKO animal (B) compared with a Cre− control (A). Examples are shown of positive cells counted for stereological results (arrows). C, D, GABA staining in the same Fgfr2 cKO (D) and Cre− control (C) animals showing reduced cell density in the dorsolateral septum. Examples are shown of positive cells counted for stereological results (arrows). E–H, Correlation plots showing the absence of correlation between total cortical TBR1 number and GABA neuron density in septum (E) and BST (G) and the significant correlations (*p < 0.05; **p < 0.01) between TBR1 neuron number in mPFC and GABA neuron density in septum (F) and BST (H).

Similar articles

Cited by

References

    1. Ananth H, Popescu I, Critchley HD, Good CD, Frackowiak RS, Dolan RJ. Cortical and subcortical gray matter abnormalities in schizophrenia determined through structural magnetic resonance imaging with optimized volumetric voxel-based morphometry. Am J Psychiatry. 2002;159:1497–1505. - PubMed
    1. Bachler M, Neubüser A. Expression of members of the Fgf family and their receptors during midfacial development. Mech Dev. 2001;100:313–316. - PubMed
    1. Borello U, Cobos I, Long JE, McWhirter JR, Murre C, Rubenstein JL. FGF15 promotes neurogenesis and opposes FGF8 function during neocortical development. Neural Dev. 2008;3:17. - PMC - PubMed
    1. Capurso SA, Calhoun ME, Sukhov RR, Mouton PR, Price DL, Koliatsos VE. Deafferentation causes apoptosis in cortical sensory neurons in the adult rat. J Neurosci. 1997;17:7372–7384. - PMC - PubMed
    1. Chellaiah A, Yuan W, Chellaiah M, Ornitz DM. Mapping ligand binding domains in chimeric fibroblast growth factor receptor molecules. J Biol Chem. 1999;274:34785–34794. - PubMed

Publication types

MeSH terms

Substances