Comparative Study
. 2010 Apr 21;30(16):5603-16.
doi: 10.1523/JNEUROSCI.0367-10.2010.

Social interactions determine postural network sensitivity to 5-HT

Affiliations
Comparative Study

Social interactions determine postural network sensitivity to 5-HT

Daniel Cattaert et al. J Neurosci. .

Abstract

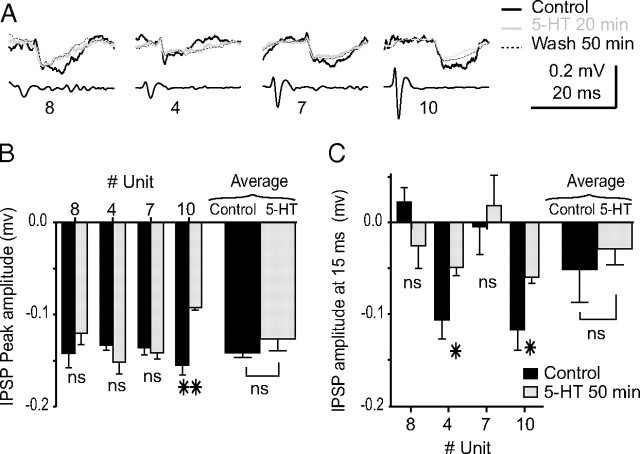
The excitability of the leg postural circuit and its response to serotonin (5-HT) were studied in vitro in thoracic nervous system preparations of dominant and subordinate male crayfishes. We demonstrate that the level of spontaneous tonic activity of depressor and levator motoneurons (MNs) (which control downward and upward movements of the leg, respectively) and the amplitude of their resistance reflex are larger in dominants than in subordinates. Moreover, we show that serotonergic neuromodulation of the postural circuit also depends on social status. Depressor and levator MN tonic firing rates and resistance reflex amplitudes were significantly modified in the presence of 10 mum 5-HT in dominants but not in subordinates. Using intracellular recording from depressor MNs, we show that their input resistance was not significantly different in dominants and subordinates in control conditions. However, 5-HT produced a marked depolarization in dominants and a significantly weaker depolarization in subordinates. Moreover, in the presence of 5-HT, the amplitude of the resistance reflex and the input resistance of MNs increased in dominants and decreased in subordinates. The peak amplitude and the decay phase of unitary EPSPs triggered by sensory spikes were significantly increased by 5-HT in dominants but not in subordinates. These observations suggest that neural networks are more reactive in dominants than in subordinates, and this divergence is even reinforced by 5-HT modulation.


Figures

Figure 1.
Figure 1.
In vitro preparation for the study of the resistance reflex of the second leg joint of the crayfish. A, The in vitro preparation of the crayfish thoracic locomotor system consists of thoracic ganglia 3–5 (T3, T4, T5) and the first abdominal ganglion (A1) dissected out together with motor nerves of the proximal muscles (Pro n, promotor; Rem n, remotor; Lev n, levator; Dep n, depressor) and the CBCO, a proprioceptor that encodes the vertical movements of the leg. A mechanical puller allowed us to mimic the vertical movements (mvt) of the leg by stretching and releasing the CBCO strand. The CNS was isolated from the CBCO by a Vaseline wall to superfuse only the ganglia with 5-HT (10 μm). Single or multiple intracellular recordings from motoneurons were performed within the neuropile with glass microelectrodes (ME). B, Disposition of the glass microelectrode used for intracellular recording from depressor MNs. The recording microelectrode was placed in the main neurite.
Figure 2.
Figure 2.
Tonic activity recorded in vitro from the depressor nerve of dominant and subordinate crayfishes. A, Individual firing rates calculated from depressor global nerve activity from 21 dominant- and 17 subordinate-animal preparations. B, C, Frequency distribution of the depressor nerve firing rate in dominant-animal preparations (B) and subordinate-animal preparations (C). D, E, Individual firing rates of depressor (Dep), levator (Lev), promotor (Pro), and remotor (Rem) motor nerves from eight dominant (D) and eight subordinate (S) animal preparations (D) and statistical analysis of firing rates calculated over all dominants and all subordinates for depressor, levator, promotor, and remotor motor nerves (E). *p < 0.05, Mann–Whitney test. Vertical bars represent SEM. ns, Not significant.
Figure 3.
Figure 3.
Effect of 10 μm 5-HT on depressor nerve tonic activity. A, B, Raw data of depressor nerve recording during 5-HT application (horizontal bar) in preparations from dominant (A) and subordinate (B) animals. The frequency (Freq) of the global depressor nerve (Dep n) activity (gray) is presented above each depressor nerve recording (black). Two recordings from subordinate-animal preparations are presented: one with a low level of tonic activity (B1) and one totally silent before 5-HT application (B2). C, Mean firing rates of the depressor nerve measured from eight dominant animals (left) and eight subordinate animals (right) in control situation after 10 min of 5-HT and after a 50 min rinse. D, Statistical analysis of the data presented in C. Vertical bars represent SEM. **p < 0.01.
Figure 4.
Figure 4.
Effect of 10 μm 5-HT on the resistance reflex recorded from the depressor nerve. Raw data of the CBCO nerve (CBCOn) and the depressor nerve (Dep n) and the sine-wave movement (mvt) applied to the CBCO. The floating mean frequency (1 s) of the discharge is presented above each recording (gray lines). A histogram representing the distribution of the mean reflex discharge frequency (Frq) on two movement periods calculated over 50 cycles is presented on top. A, Dominant-animal preparation in control situation (A1) and after 10 min in the presence of 10 μm 5-HT (A2). B, Same as A in a subordinate-animal preparation.
Figure 5.
Figure 5.
Statistical analysis of the effect of 5-HT on the resistance reflex recorded from the depressor and levator motor nerves. A, Comparison of the effects of 10 μm 5-HT on depressor firing rate in dominant (left) and subordinate (right) animal preparations in control situation (black bars) and after 10 min in the presence of 10 μm 5-HT (gray bars). B, Comparison of the effects of 10 μm 5-HT on levator firing rate in dominant (left) and subordinate (right) animal preparations in control situation (black bars) and after 10 min in the presence of 10 μm 5-HT (gray bars). ns, Not significant. *p < 0.05; **p < 0.01.
Figure 6.
Figure 6.
Effect of 10 μm 5-HT on the membrane potential of intracellularly recorded depressor MNs. A, B, Raw data of intracellular recordings from depressor (Dep) MNs during application of 10 μm 5-HT (horizontal bar) in dominant-animal preparations (A1, B1) and in subordinate-animal preparations (A2, B2). A, Free-run membrane potential. B, In other depressor MNs, the membrane potential was adjusted to −78 mV by negative-current injection before 5-HT application. C, Effects of 5-HT on the membrane potential of depressor MNs from eight dominant-animal preparations (left) and eight subordinate-animal preparations (right).
Figure 7.
Figure 7.
Effect of 10 μm 5-HT on the amplitude of the resistance reflex response of intracellularly recorded depressor MNs. A, B, Raw data of intracellular recordings from depressor (Dep) MNs during sine-wave movements (mvt) applied to the CBCO in control condition (black) and after 10 min in the presence of 10 μm 5-HT (gray) in a dominant (A) and in a subordinate (B) animal preparation. C, D, Time course of the effect of 10 μm 5-HT on the amplitude of the resistance reflex response in a dominant (C) and in a subordinate (D) animal preparation (each vertical bar represents the mean ± SEM calculated over 10 movement cycles). E, Statistical analysis of the time course of the effects of 10 μm 5-HT on the amplitude of the resistance reflex response in dominants (n = 5) and subordinate (n = 5).
Figure 8.
Figure 8.
Effect of 10 μm 5-HT on the input resistance and membrane time constant of intracellularly recorded depressor MNs. A, B, Raw data of intracellular recordings from depressor during application of −1 nA current pulse in a dominant (A) and in a subordinate (B) animal preparation. Black trace, Control recording; gray trace, after 10 min in the presence of 10 μm 5-HT; dotted line, after 50 min rinse. C, D, Procedure to calculate the membrane time constant in control (black trace) and after 10 min in the presence of 10 μm 5-HT (gray trace). The traces taken from the recovery after −1 nA current pulse injection (see rectangles in A and B) are fitted with one exponential decay curves. C, Dominant-animal preparation; D, subordinate-animal preparation. E, Statistical analysis of the time course of the effects of 10 μm 5-HT on the input resistance of depressor MNs from dominants (♦, n = 5) and subordinates (◇, n = 5). F, Same disposition for the membrane time constant. ns, Not significant. *p < 0.05; **p < 0.01; ***p < 0.001.
Figure 9.
Figure 9.
Effect of 10 μm 5-HT on the shape of EPSPs recorded from depressor MNs in dominant-animal preparations. A, Seven EPSPs were obtained in the same intracellularly recorded depressor MN by spike-trigger averaging from templates of CBCO spikes (see Materials and Methods) in control situation (black trace), 20 min after 10 μm 5-HT application (gray trace), and after a 50 min wash (dotted line). Each corresponding presynaptic sensory spike is presented below each EPSP trace. In 5-HT condition, asterisks indicate marked increase in the shape of the EPSP repolarizing phase, arrows indicate marked increase in the peak amplitude of EPSPs, and open triangles indicate an absence of effect on the peak amplitude of the EPSP. B, Statistical analysis of the peak amplitude of each EPSP in control condition (black bars) and after a 50 min wash post-5-HT application (gray bars). The two wider bars on the right represent the mean peak amplitude of the seven EPSPs. C, Same disposition as in B for the amplitude of the EPSP measured 15 ms after the peak. A, B, and C are from the same experiment. In a subordinate-animal preparation, five EPSPs were identified from this depressor MN (same disposition as in A). D, E, Over all experiments, effects of 5-HT on EPSP peak amplitude (n = 39 EPSPs) (D) and on EPSP amplitude measured 15 min after the peak (n = 39 EPSPs) (E). F, Statistical analysis comparing the means using paired t test. *p < 0.05; **p < 0.01; ***p < 0.001; ****p < 0.0001.
Figure 10.
Figure 10.
Effect of 10 μm 5-HT on the shape of IPSPs recorded from depressor MNs in dominant-animal preparations. Same disposition as in Figure 9.
Figure 11.
Figure 11.
Effect of 10 μm 5-HT on the shape of EPSPs recorded from depressor MNs in subordinate-animal preparations. Same disposition as in Figure 9.
Figure 12.
Figure 12.
Effect of 10 μm 5-HT on the shape of IPSPs recorded from depressor MNs in subordinate-animal preparations. A, Four unitary IPSPs were identified over the four experiments analyzed (same disposition as in Fig. 9A). B, C, Statistical analysis of the peak amplitude (B) and the amplitude of the EPSP measured 15 ms after the peak (C) of each IPSP in control condition (black bars) and after a 50 min wash post-5-HT application (gray bars) (same disposition as in Fig. 9,B,C).

Similar articles

Cited by

References

    1. Antonsen BL, Edwards DH. Mechanisms of serotonergic facilitation of a command neuron. J Neurophysiol. 2007;98:3494–3504. - PubMed
    1. Beltz BS. Distribution and functional anatomy of amine-containing neurons in decapod crustaceans. Microsc Res Tech. 1999;44:105–120. - PubMed
    1. Beltz BS, Kravitz EA. Mapping of serotonin-like immunoreactivity in the lobster nervous system. J Neurosci. 1983;3:585–602. - PMC - PubMed
    1. Beltz BS, Kravitz EA. Physiological identification, morphological analysis, and development of identified serotonin-proctolin containing neurons in the lobster ventral nerve cord. J Neurosci. 1987;7:533–546. - PMC - PubMed
    1. Cai X, Flores-Hernandez J, Feng J, Yan Z. Activity-dependent bidirectional regulation of GABA(A) receptor channels by the 5-HT(4) receptor-mediated signalling in rat prefrontal cortical pyramidal neurons. J Physiol. 2002;540:743–759. - PMC - PubMed

Publication types

LinkOut - more resources