Comparative Study
. 2010 Apr 21;30(16):5644-52.
doi: 10.1523/JNEUROSCI.5956-09.2010.

Metabolic vulnerability disposes retinal ganglion cell axons to dysfunction in a model of glaucomatous degeneration

Affiliations
Comparative Study

Metabolic vulnerability disposes retinal ganglion cell axons to dysfunction in a model of glaucomatous degeneration

Selva Baltan et al. J Neurosci. .

Abstract

We tested the hypothesis that glaucoma disrupts electrophysiological conduction properties and axon function in optic nerve as a function of intraocular pressure (IOP) levels and age in the DBA/2J mouse model of glaucoma. The amplitude and the integral of electrical signals evoked along the axons decreased considerably by 6 months of age as a function of increasing IOP levels. At young ages, raised IOP was directly associated with increased vulnerability to metabolic challenge. Changes in the physiological function of the optic nerves were accentuated with aging, leading to loss of compound action potential in an entire population of fibers: small, slow conducting axons. This loss was accompanied with loss of small fiber axon counts and declining metabolic reserve by demonstrating IOP-dependent ATP decrease in mouse optic nerves. These data shed light on a novel potential mechanism of glaucoma pathology whereby increased IOP and declining metabolic capacity lead to axon liability and eventually dysfunction and loss.


Figures
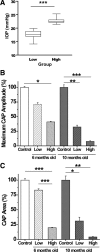
Figure 1.
Figure 1.
A, Final IOP measurements taken from eyes used in the physiology experiments. Low and high IOP groups contain measures from 6- and 10-month-old DBA/2 mice that were chosen for their IOP difference within their age group. Mean IOP in the low group is 17.5 ± 0.3 mmHg, and the high group mean is 22.6 ± 0.25 mmHg; these means are significantly different (t test, ***p < 0.0001). B, Maximum CAP amplitude (millivolts) as a percentage of control for each of the control and experimental groups. There is a significant decrease in maximum CAP amplitude with high IOP, regardless of age (6 months, ANOVA, *p < 0.05; and 10 months, ANOVA, ***p < 0.001). Maximum CAP amplitudes for low versus high IOP in both 6 and 10 month groups are significantly different (p < 0.001). Young and 10 month control maximum CAP amplitude are significantly different (**p < 0.01), as are 6 and 10 month high IOP maximum CAP amplitudes (p < 0.001). C, CAP area (millivolts per milliseconds) as a percentage of control for control and experimental groups. There is a significant decrease in CAP area with high IOP, regardless of age (6 months, ANOVA, ***p < 0.0001; and 10 months, ANOVA, **p < 0.01). CAP areas for low versus high IOP in both 6 and 10 month groups are significantly different (***p < 0.001). Young and 10 month control CAP areas are significantly different (*p < 0.05), as are 6 and 10 month high IOP CAP areas (p < 0.01). See Table 2 for values and n values. For graphs in B and C and all graphs in subsequent figures, the young control group (white bar) is 6-week-old DBA/2J ON, whereas the 10-month-old control (black bar) is C57BL/6 ON; non-glaucomatous mice with a DBA/2J genetic background could not be obtained.
Figure 2.
Figure 2.
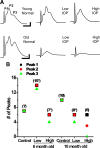
A, Representative CAP traces for the control and experimental groups. The CAP peaks (P1, P2, and P3) are labeled, with each peak depicting the output from the fast (P1), medium (P2), and slow (P3) conducting axons within the mouse optic nerve. Young normal IOP (6 week DBA/2J) and young mice (6-month-old) with low IOP look similar, whereas some decrement in the size and features of the CAP trace can be observed in the young mice with high IOP. The old normal IOP (10 month C57BL/6) mouse has a recognizable three-peaked CAP trace, whereas there is a noticeable decline in CAP trace size at both 10 month low and high IOP. B, Graph showing number of CAP peaks across control and experimental groups. Number in parentheses (n) indicates number of ON, and * indicates that there was 1 (or more, note symbol placement) ON in that group in which no CAP could be elicited using supramaximal stimulation. Position of squares shows the number of ON CAPs with P1, circles represent P2 numbers, and triangles represent P3. There was one CAP that did not have P3 in the 6 month low IOP group, whereas two CAPs lacked P3 in the 6 month high IOP group. At 10 months, the low IOP group had two ONs lacking P3; two ONs overall in this group could not generate a CAP. Every ON in the 10 month high IOP group has lost P3 from the CAP trace, whereas half also lost P2, a significant decrease in peak number (one-way ANOVA, p < 0.01). See Table 2 for values and n values.
Figure 3.
Figure 3.
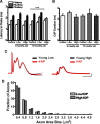
A, Graph showing latency to peak (milliseconds) for each control and experimental group. There are no significant differences in peak latency within the young (6 month) group; by 10 months, latency for each of the peaks at low IOP has crept up, a trend that is exacerbated in the 10 month high IOP group. The latency for P1 in high IOP at 10 months is significantly different from control (t test, ***p < 0.0001). P3 never arrives for the 10 month high IOP group. B, CAP duration (milliseconds) for control and experimental groups. The CAP recording time for each nerve does not vary significantly across age or IOP. See Table 2 for values and n values. C, Representative CAP traces in young ON at low and high IOP before and after treatment with 4-AP. The absence of changes in CAP amplitude or latency with 4-AP suggest that K+ channels are not exposed as they would be in demyelinated axons. D, Histogram of axon area measures as a fraction of total axons obtained from high-magnification plastic ON cross-sections in 5- to 8-month-old DBA/2J mice with low or high IOP (n = 20 for each IOP group). Axons were binned into 0.4 μm groups. There is a decrease in the fraction of axons with areas (not including myelin) between 0.0 and 0.4 μm2 and 0.5 and 0.8 μm2 in the high IOP mice. These areas correspond to axons with diameters between 0.01 and 0.56 μm.
Figure 4.
Figure 4.
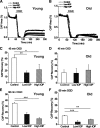
A, B, Graphs of normalized percentage CAP area (recovery) after 60 min OGD in young (A) and old (B) optic nerve (companion bar charts in E and F). CAPs are elicited for 60 min before initiation of OGD. Collapse of CAP occurs within minutes of OGD; at 120 min of recording, oxygen and glucose are returned to the bath and CAPs recorded. Control (open circles) ON shows greatest CAP recovery after OGD at young ages (A); control CAP does not recover in old age (B). A, Young ON with low IOP (open squares) has CAP recovery lower than control but higher than high IOP (filled circles). B, In old ON, mice with high IOP (filled circles) recover significantly more CAP area than low IOP (open squares). C, Percentage of CAP recovery from 45 min of OGD in young ON. With this level of OGD in young ON, there is no difference of IOP exposure to CAP recovery, but recovery for both was significantly different from control (one-way ANOVA, **p < 0.01, *p < 0.05). D, Percentage of CAP recovery from 45 min OGD in old ON. As with the young ON, there is no difference in CAP recovery between low and high IOP groups in old ON. E, Percentage of CAP recovery from 60 min of OGD in young ON. There was a significant decrease in CAP recovery with increasing IOP (one-way ANOVA, ***p < 0.0001). F, Percentage of CAP recovery from 60 min OGD in old ON. In contrast to young ON, there was better CAP recovery at high IOP in old ON, but recovery was significantly different from control for both low (one-way ANOVA, ***p < 0.001) and high (one-way ANOVA, **p < 0.01) IOP groups. See Table 2 for values and n values.
Figure 5.
Figure 5.
Scatter plot of CAP recovery percentage by IOP (mmHg) after 60 min OGD for young mice in the high IOP group. IOP is a reliable predictor of CAP recovery (r2 = 0.63) for young DBA/2J; mice with the highest final IOP had the poorest CAP recovery overall.
Figure 6.
Figure 6.
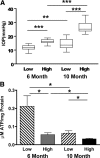
A, Box plots of mean IOP for mice used in the ON ATP determinations. Mean IOP of young (6 month) low is 11.7 ± 1.8 mmHg (n = 12), and high is 16.3 ± 1.5 mmHg (n = 13); mean IOP of old (10 month) low is 14.7 ± 3.8 mmHg (n = 16), and high is 26.3 ± 3.6 mmHg (n = 15; t test, **p < 0.01, ***p < 0.001). B, ATP levels (micromoles of ATP per milligrams of ON protein) were measured in young and old DBA/2J ON at low and high IOP. IOP had a significant effect on ATP levels in young and old ON, with significantly decreased ON ATP in low versus high IOP groups (t test, *p < 0.012 for young; *p < 0.049 for old). There is also a significant difference in the ATP levels in young versus old at low (t test, *p < 0.014) and high (t test, *p < 0.028) IOP.

Similar articles

Cited by

References

    1. Anderson MG, Smith RS, Hawes NL, Zabaleta A, Chang B, Wiggs JL, John SW. Mutations in genes encoding melanosomal proteins cause pigmentary glaucoma in DBA/2J mice. Nat Genet. 2002;30:81–85. - PubMed
    1. Anderson MG, Libby RT, Gould DB, Smith RS, John SW. High-dose radiation with bone marrow transfer prevents neurodegeneration in an inherited glaucoma. Proc Natl Acad Sci U S A. 2005;102:4566–4571. - PMC - PubMed
    1. Badea TC, Nathans J. Quantitative analysis of neuronal morphologies in the mouse retina visualized by using a genetically directed reporter. J Comp Neurol. 2004;480:331–351. - PubMed
    1. Baltan S, Besancon EF, Mbow B, Ye Z, Hamner MA, Ransom BR. White matter vulnerability to ischemic injury increases with age because of enhanced excitotoxicity. J Neurosci. 2008;28:1479–1489. - PMC - PubMed
    1. Baltan S, Inman DM, Danilov C, Morrison RS, Calkins DJ, Horner PJ. Reduced ATP levels dispose small size axons to dysfunction in DBA/2J glaucoma mice. Soc Neurosci Abstr. 2009;35:724–5.

Publication types