Promoter DNA methylation patterns of differentiated cells are largely programmed at the progenitor stage
- PMID: 20410135
- PMCID: PMC2883950
- DOI: 10.1091/mbc.e10-01-0018
Promoter DNA methylation patterns of differentiated cells are largely programmed at the progenitor stage
Abstract
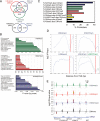
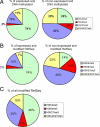
Mesenchymal stem cells (MSCs) isolated from various tissues share common phenotypic and functional properties. However, intrinsic molecular evidence supporting these observations has been lacking. Here, we unravel overlapping genome-wide promoter DNA methylation patterns between MSCs from adipose tissue, bone marrow, and skeletal muscle, whereas hematopoietic progenitors are more epigenetically distant from MSCs as a whole. Commonly hypermethylated genes are enriched in signaling, metabolic, and developmental functions, whereas genes hypermethylated only in MSCs are associated with early development functions. We find that most lineage-specification promoters are DNA hypomethylated and harbor a combination of trimethylated H3K4 and H3K27, whereas early developmental genes are DNA hypermethylated with or without H3K27 methylation. Promoter DNA methylation patterns of differentiated cells are largely established at the progenitor stage; yet, differentiation segregates a minor fraction of the commonly hypermethylated promoters, generating greater epigenetic divergence between differentiated cell types than between their undifferentiated counterparts. We also show an effect of promoter CpG content on methylation dynamics upon differentiation and distinct methylation profiles on transcriptionally active and inactive promoters. We infer that methylation state of lineage-specific promoters in MSCs is not a primary determinant of differentiation capacity. Our results support the view of a common origin of mesenchymal progenitors.
Figures


Comment in
-
Biological significance of DNA methylation patterns in human progenitor cells.Epigenomics. 2011 Feb;3(1):12-3. Epigenomics. 2011. PMID: 22232810 No abstract available.
Similar articles
-
Lineage-specific promoter DNA methylation patterns segregate adult progenitor cell types.Stem Cells Dev. 2010 Aug;19(8):1257-66. doi: 10.1089/scd.2009.0309. Stem Cells Dev. 2010. PMID: 19886822
-
Tissue source determines the differentiation potentials of mesenchymal stem cells: a comparative study of human mesenchymal stem cells from bone marrow and adipose tissue.Stem Cell Res Ther. 2017 Dec 6;8(1):275. doi: 10.1186/s13287-017-0716-x. Stem Cell Res Ther. 2017. PMID: 29208029 Free PMC article.
-
Chromatin states of developmentally-regulated genes revealed by DNA and histone methylation patterns in zebrafish embryos.Int J Dev Biol. 2010;54(5):803-13. doi: 10.1387/ijdb.103081ll. Int J Dev Biol. 2010. PMID: 20336603
-
Epigenetic programming of mesenchymal stem cells from human adipose tissue.Stem Cell Rev. 2006;2(4):319-29. doi: 10.1007/BF02698059. Stem Cell Rev. 2006. PMID: 17848719 Review.
-
Programming differentiation potential in mesenchymal stem cells.Epigenetics. 2010 Aug 16;5(6):476-82. doi: 10.4161/epi.5.6.12517. Epub 2010 Aug 16. Epigenetics. 2010. PMID: 20574163 Review.
Cited by
-
Lamin A/C-promoter interactions specify chromatin state-dependent transcription outcomes.Genome Res. 2013 Oct;23(10):1580-9. doi: 10.1101/gr.159400.113. Epub 2013 Jul 16. Genome Res. 2013. PMID: 23861385 Free PMC article.
-
DNA methylation dynamics in muscle development and disease.Front Aging Neurosci. 2015 Mar 5;7:19. doi: 10.3389/fnagi.2015.00019. eCollection 2015. Front Aging Neurosci. 2015. PMID: 25798107 Free PMC article. Review.
-
Epigenetic marks define the lineage and differentiation potential of two distinct neural crest-derived intermediate odontogenic progenitor populations.Stem Cells Dev. 2013 Jun 15;22(12):1763-78. doi: 10.1089/scd.2012.0711. Epub 2013 Mar 15. Stem Cells Dev. 2013. PMID: 23379639 Free PMC article.
-
Developmental features of DNA methylation during activation of the embryonic zebrafish genome.Genome Biol. 2012 Jul 25;13(7):R65. doi: 10.1186/gb-2012-13-7-r65. Genome Biol. 2012. PMID: 22830626 Free PMC article.
-
Local euchromatin enrichment in lamina-associated domains anticipates their repositioning in the adipogenic lineage.Genome Biol. 2022 Apr 11;23(1):91. doi: 10.1186/s13059-022-02662-6. Genome Biol. 2022. PMID: 35410387 Free PMC article.
References
-
- Asbreuk C. H., van Schaick H. S., Cox J. J., Smidt M. P., Burbach J. P. Survey for paired-like homeodomain gene expression in the hypothalamus: restricted expression patterns of Rx, Alx4 and goosecoid. Neuroscience. 2002;114:883–889. - PubMed
-
- Azuara V., et al. Chromatin signatures of pluripotent cell lines. Nat. Cell Biol. 2006;8:532–538. - PubMed
-
- Bernstein B. E., et al. A bivalent chromatin structure marks key developmental genes in embryonic stem cells. Cell. 2006;125:315–326. - PubMed
-
- Boquest A. C., Noer A., Collas P. Epigenetic programming of mesenchymal stem cells from human adipose tissue. Stem Cell Rev. 2006;2:319–329. - PubMed
-
- Boquest A. C., Noer A., Sorensen A. L., Vekterud K., Collas P. CpG methylation profiles of endothelial cell-specific gene promoter regions in adipose tissue stem cells suggest limited differentiation potential toward the endothelial cell lineage. Stem Cells. 2007;25:852–861. - PubMed
Publication types
MeSH terms
Substances
LinkOut - more resources
Full Text Sources
Other Literature Sources
Molecular Biology Databases

