. 2010 Jul;95(7):3325-31.
doi: 10.1210/jc.2009-2590. Epub 2010 Apr 21.

Human phase response curves to three days of daily melatonin: 0.5 mg versus 3.0 mg

Affiliations

Human phase response curves to three days of daily melatonin: 0.5 mg versus 3.0 mg

Helen J Burgess et al. J Clin Endocrinol Metab. 2010 Jul.

Abstract

Context: Phase response curves (PRCs) to melatonin exist, but none compare different doses of melatonin using the same protocol.

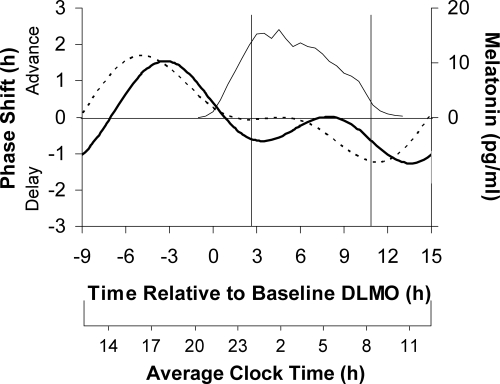
Objective: The aim was to generate a PRC to 0.5 mg of oral melatonin and compare it to our previously published 3.0 mg PRC generated using the same protocol.

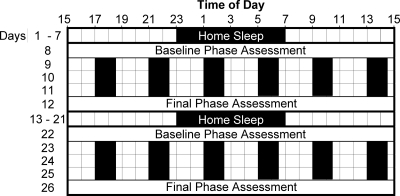
Design and setting: The study included two 5-d sessions in the laboratory, each preceded by 7-9 d of fixed sleep times. Each session started and ended with a phase assessment to measure the dim light melatonin onset (DLMO). In between were 3 d in an ultradian dim light (<150 lux)/dark cycle (light:dark, 2.5:1.5).

Participants: Healthy adults (16 men, 18 women) between the ages of 18 and 42 yr participated in the study.

Interventions: During the ultradian days of the laboratory sessions, each participant took one pill per day at the same clock time (0.5 mg melatonin or placebo, double blind, counterbalanced).

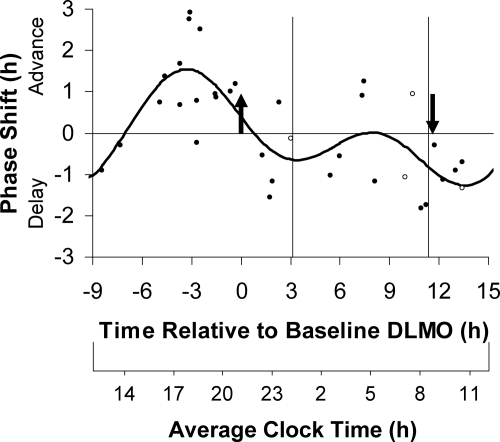
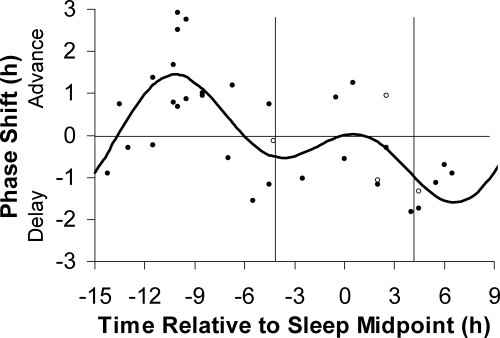
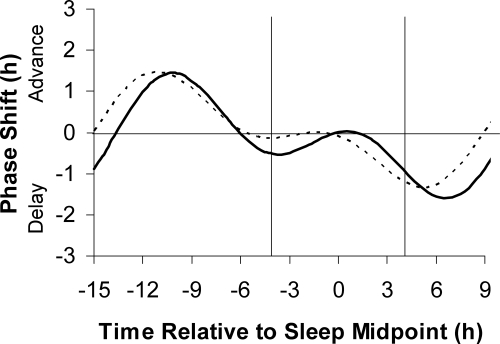
Main outcome measure: Phase shifts to melatonin were derived by subtracting the phase shift to placebo. A PRC with time of pill administration relative to baseline DLMO and a PRC relative to midpoint of home sleep were generated.

Results: Maximum advances occurred when 0.5 mg melatonin was taken in the afternoon, 2-4 h before the DLMO, or 9-11 h before sleep midpoint. The time for maximum phase delays was not as distinct, but a fitted curve peaked soon after wake time.

Conclusions: The optimal administration time for advances and delays is later for the lower dose of melatonin. When each dose of melatonin is given at its optimal time, both yield similarly sized advances and delays.


Figures

Figure 1
Figure 1
Diagram of the protocol. Subjects slept on a fixed sleep schedule (8 to 9 h per night) tailored to their habitual sleep times for 7 d (example of 2300 to 0700 h shown in figure), and then participated in a laboratory session for 5 d. Subjects returned to sleeping on the fixed sleep schedule for 9 d before returning for a second laboratory session. During the phase assessments, on d 8, 12, 22, and 26, saliva was sampled every 30 min in dim light (<5 lux) to measure the entire melatonin profile and calculate the DLMOs. There were 3 d of an ultradian light/dark cycle during each laboratory session in which subjects lay on cots in the dark (0 lux) for 1.5 h, were permitted to sleep (represented by black bars), and were kept awake for 2.5 h in room light [<150 lux, 37.3 ± 13.8 lux (mean ± sd)] and were permitted to eat and drink ad libitum. For each of the 3 ultradian days, subjects were given a pill at the start of one of the wake episodes, thus at the same clock time each day. During one laboratory session, the pill was melatonin (0.5 mg immediate release), and during the other session it was placebo, counterbalanced, double-blind. Different groups of three to four subjects received the pills at the start of different awake episodes to cover the entire 24-h day. The phase shift during each laboratory session was the baseline DLMO minus the final DLMO. The phase shift (free-run) during the placebo session was subtracted from the phase shift during the melatonin session and plotted against the time of melatonin administration relative to baseline DLMO or relative to home sleep midpoint to generate the PRCs.
Figure 2
Figure 2
The three-pulse PRC to 0.5 mg of exogenous oral melatonin generated from subjects free-running during 3 d of an ultradian light/dark cycle (LD 2.5:1.5). Phase shifts of the circadian clock, measured by changes in the timing of the DLMO, are plotted against the time of administration of the melatonin pill relative to the baseline DLMO (top x-axis). The average baseline DLMO is represented by the upward arrow, the average baseline DLMOff by the downward arrow, and the average assigned baseline sleep times at home from before the laboratory sessions are enclosed by the vertical lines. Each dot represents the phase shift of an individual subject, calculated by subtracting the phase shift during the placebo session (free-run) from the phase shift during the melatonin session. The open circles represent the four women who had varying hormone levels during the study due to the use of hormonal birth control. The curved line illustrates the dual harmonic curve fit. The average clock time axis (bottom x-axis) corresponds to the average baseline sleep times at home.
Figure 3
Figure 3
The three-pulse PRC to 0.5 mg of exogenous oral melatonin generated from subjects free-running during 3 d of an ultradian light/dark cycle (LD 2.5:1.5). Phase shifts of the circadian clock, measured by the DLMO, are plotted against the time of administration of the melatonin pill relative to the midpoint of each individual’s assigned baseline sleep schedule at home from before the laboratory sessions. The vertical lines represent the average assigned baseline bedtime and wake time. Each dot represents the phase shift of an individual subject, calculated by subtracting the phase shift during the placebo session (free-run) from the phase shift during the melatonin session. The open circles represent the four women who had varying hormone levels during the study due to the use of hormonal birth control. The curved line illustrates the dual harmonic curve fit.
Figure 4
Figure 4
The dual harmonic curve fits to the three-pulse PRC generated to 0.5 mg of exogenous oral melatonin (solid curve) and to 3.0 mg of exogenous oral melatonin (dashed curve). Phase shifts of the DLMO (left y-axis) are plotted against the time of administration of the melatonin pill relative to the baseline DLMO (top x-axis). The average baseline melatonin profile (thin line, right y-axis) and the average assigned baseline sleep times from before the laboratory sessions (vertical lines) for both groups are shown. The average clock time axis (bottom x-axis) corresponds to the average baseline sleep times at home.
Figure 5
Figure 5
The three-pulse PRC to 0.5 mg (solid curve) and 3.0 mg (dashed curve) of exogenous oral melatonin generated from subjects free-running during 3 d of an ultradian light/dark cycle (LD 2.5:1.5). Phase shifts of the circadian clock, measured by the DLMO, are plotted against the time of administration of the melatonin pill relative to the midpoint of each individual’s assigned baseline sleep schedule at home before the laboratory sessions. The vertical lines show the average assigned baseline bedtime and wake time.

Comment in

Similar articles

Cited by

References

    1. Redman J, Armstrong S, Ng KT 1983 Free-running activity rhythms in the rat: entrainment by melatonin. Science 219:1089–1091 - PubMed
    1. Arendt J, Bojkowski C, Folkard S, Franey C, Marks V, Minors D, Waterhouse J, Wever RA, Wildgruber C, Wright J 1985 Some effects of melatonin and the control of its secretion in humans. In: Evered D, Clark S, eds. Photoperiodism, melatonin, and the pineal. London: Pitman; 266–283 - PubMed
    1. Lewy AJ, Bauer VK, Ahmed S, Thomas KH, Cutler NL, Singer CM, Moffit MT, Sack RL 1998 The human phase response curve (PRC) to melatonin is about 12 hours out of phase with the PRC to light. Chronobiol Int 15:71–83 - PubMed
    1. Burgess HJ, Revell VL, Eastman CI 2008 A three pulse phase response curve to three milligrams of melatonin in humans. J Physiol 586:639–647 - PMC - PubMed
    1. Comas M, Beersma DG, Spoelstra K, Daan S 2006 Phase and period responses of the circadian system of mice (Mus musculus) to light stimuli of different duration. J Biol Rhythms 21:362–372 - PubMed

Publication types