. 2010 Jul;40(7):1916-26.
doi: 10.1002/eji.201040310.

Modulating numbers and phenotype of CD8+ T cells in secondary immune responses

Affiliations

Modulating numbers and phenotype of CD8+ T cells in secondary immune responses

Thomas C Wirth et al. Eur J Immunol. 2010 Jul.

Abstract

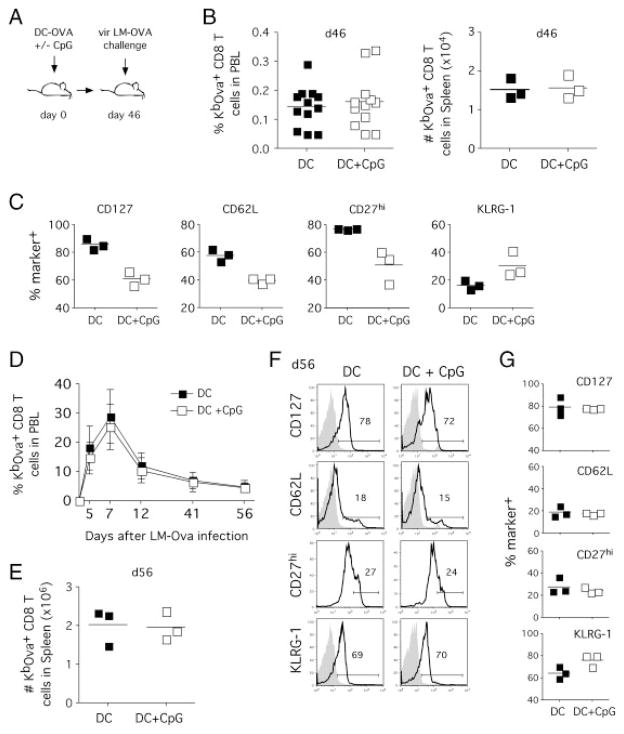
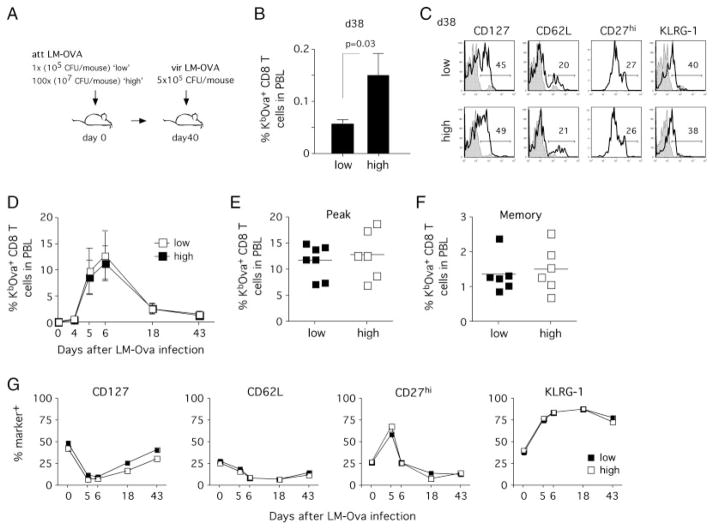
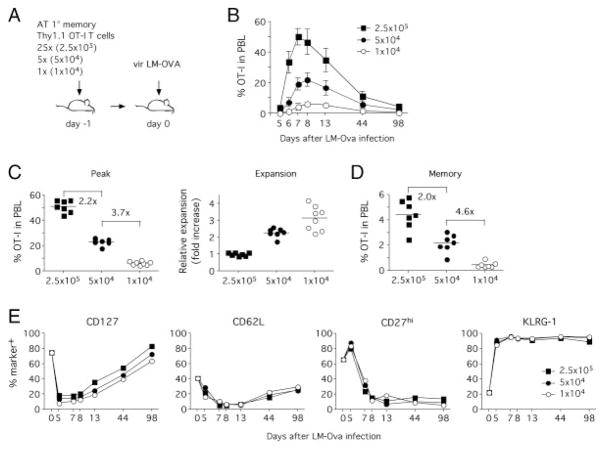
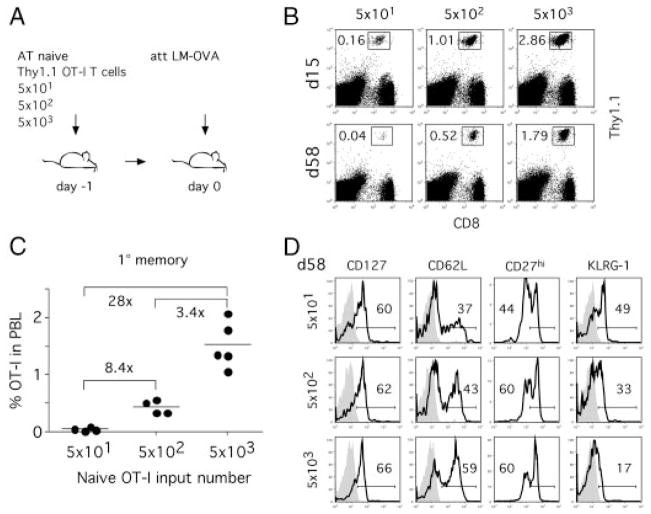
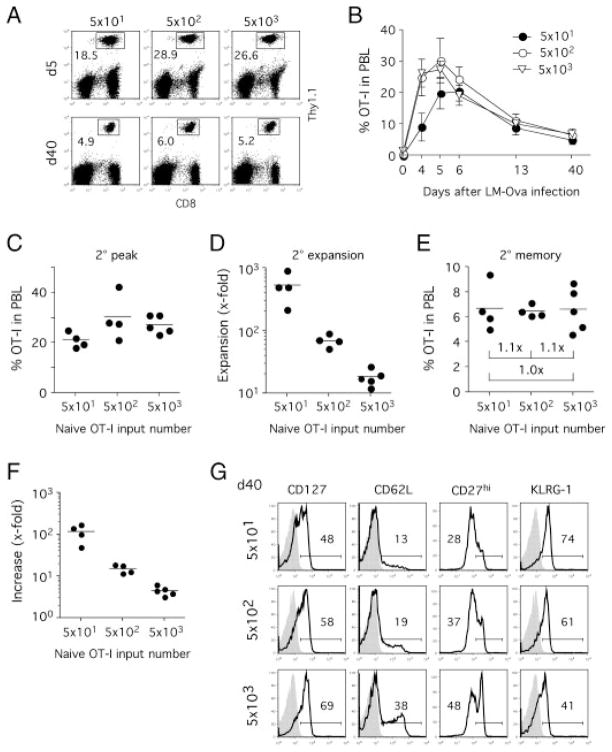
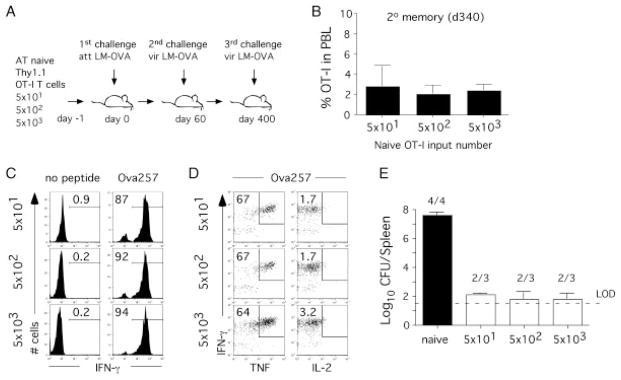
Prime-boost regimens are frequently used to increase the number of memory CD8(+) T cells and thus the protective capacity of experimental vaccinations; however, it is currently unknown how the frequency and phenotype of primary (1 degrees ) memory CD8(+) T cells impact the quantity and phenotype of secondary (2 degrees ) memory CD8(+) T-cell populations. Here, we show that 2 degrees infections of mice that received different 1 degrees infections and/or immunizations generated similar numbers of 2 degrees effector and memory CD8(+) T cells. Remarkably, this result was independent of the numbers and phenotype of 1 degrees memory CD8(+) T cells present at the time of rechallenge. However, after adoptive transfer of low numbers of 1 degrees memory CD8(+) T cells, a linear correlation between 1 degrees memory CD8(+) T-cell input and 2 degrees memory CD8(+) T-cell numbers was observed. These data suggest that, above a very low threshold, boosting of 1 degrees memory CD8(+) T-cell populations elicits 2 degrees immune responses of similar magnitude. Therefore, our study has important implications for the design of prime-boost regimens that aim to generate protective CD8(+) T-cell-mediated immunity.


Conflict of interest statement

Conflict of interest: The authors declare no financial or commercial conflict of interest.

Figures

Figure 1
Figure 1
1° memory CD8+ T cells of different phenotype induce similar 2° immune responses. (A) Experimental setup. Mice were injected with Ova257–264-coated DC with or without co-injection of CpG (1826 ODN). In total, 46 days after DC immunization, both groups were challenged with vir LM-OVA (1 × 10⁵ CFU). (B) Frequency of endogenous OVA-specific CD8+ T cells among total PBL (left panel, n = 12) and total numbers of endogenous OVA-specific CD8+ T cells in the spleen (right panel, n = 3) 46 days after immunization. (C) Phenotype of 1° memory CD8+ T cells was analyzed in the spleen 46 days after infection. Numbers show the percentage of marker-positive OVA-specific CD8+ T cells for three individual mice and the mean for each group. (D) Kinetics of 2° OVA-specific CD8+ T-cell responses in PBL after vir LM-OVA challenge. Data show mean ± SD for each group (n = 12). (E) Total numbers of OVA-specific CD8+ T cells in the spleen (day 56 after booster infection). Data show numbers for three individual mice and the mean for each group. (F) Analysis of 2° memory CD8+ T-cell phenotype in the spleen. Histograms show representative marker expression in individual mice compared with isotype controls (shaded histograms). (G) Frequency of marker-positive OVA-specific CD8+ T cells in individual mice and the mean for a group of three mice. Data are representative of two independent experiments.
Figure 2
Figure 2
Altering the dose of the 1° infection results in minor differences in the numbers of 2° memory CD8+ T cells after re-challenge. (A) Experimental setup. Groups of mice were infected with 1 × 10⁵ (low dose; 1 ×) or 1 × 10⁷ (high dose; 100 ×) CFU of att LM-OVA and re-challenged with vir LM-OVA 40 days later (5 × 10⁵ CFU/mouse). (B) Percentages of endogenous OVA-specific CD8+ T cells in total PBL on day 38 after 1° infection. Data show mean ± SD for each group (n = 8). (C) Phenotype of 1° memory CD8+ T cells in peripheral blood samples. Open histograms show representative examples of individual mice and shaded histograms represent isotype controls. (D) 2° immune responses of OVA-specific CD8+ T cells in PBL. Mean ± SD for each group are shown. Frequency of OVA-specific (E) 2° effectors (day 6) and (F) 2° memory (day 43). Data show numbers for individual mice and the mean for each group. (G) Phenotype of OVA-specific 2° effector/memory CD8+ T cells in pooled PBL samples. Data are representative of two independent experiments.
Figure 3
Figure 3
Adoptive transfer of different numbers of 1° OT-I T cells generates different numbers of 2° memory CD8+ T cells after re-challenge. (A) Experimental setup. Different numbers of 1° memory OT-I T cells (2.5 × 10⁵, 5 × 10⁴ or 1 × 10⁴) from VacV-OVA immune mice were adoptively transferred into naïve hosts (n = 8/group) and mice were challenged with vir LM-OVA. (B) Kinetics of 2° OT-I T cell responses in PBL. Graphs show percentages of OT-I T cells in total PBL (mean ± SD, n = 8). (C) Peak expansion of OT-I T cells in individual mice and mean percentage for each group (left panel). Numbers show fold differences in mean OT-I frequency between individual groups. Relative expansion (right panel) was calculated by normalizing peak expansion of OT-I T cells for input numbers with the expansion in the group receiving 2.5 × 10⁵ 1° memory OT-I T cells representing a value of 1. Results from individual mice and mean for each group are shown. (D) 2° memory OT-I frequency in total PBL (individual mice and mean for each group shown). Numbers show fold differences in mean OT-I frequency between individual groups. (E) Phenotype of OT-I T cells in pooled PBL samples. Data are representative of two independent experiments.
Figure 4
Figure 4
Naïve CD8+ T-cell precursor frequency influences the quantity and phenotype of 1° memory CD8+ T cells after infection. (A) Experimental setup. Different numbers of naïve Thy1.1 OT-I T cells were adoptively transferred into naïve Thy1.2 B6 hosts (n = 5/group) prior to infection with att LM-OVA. (B) Detection of OT-I CD8+ T cells in PBL on indicated days after infection. Numbers represent frequency of OT-I in total PBL. (C) Frequency of 1° memory OT-I T cells in PBL 58 days after infection. Numbers show fold differences in mean OT-I frequency between individual groups. (D) Phenotype of 1° memory OT-I T cells. Histograms show phenotype in pooled PBL samples for each group and isotype controls (shaded histograms). This experiment was repeated once with similar results. Data are representative of two independent experiments.
Figure 5
Figure 5
Magnitude of 2° CD8+ T-cell responses is independent of 1° memory CD8+ T-cell frequency and phenotype. (A) LM-OVA immune mice (Fig. 4) were challenged with vir LM-OVA and 2° CD8+ T-cell responses were monitored in PBL. Detection of OT-I CD8+ T cells in PBL on indicated days after 2° infection. Numbers represent frequency of OT-I in total PBL. (B) Kinetics of the 2° OT-I T cell responses in PBL. Data show mean ± SD for each group. (C) Peak frequency of 2° OT-I CD8+ T cells in PBL. (D) The fold increase in OT-I T cell numbers was calculated by comparing OT-I frequency in PBL before (1° memory) and at the peak of the 2° immune response. (E) Frequency of 2° memory OT-I T cells in PBL 40 days after vir LM-OVA infection. Numbers represent the fold difference in 2° memory OT-I T cells numbers between groups. (F) The fold increases in memory OT-I frequency were calculated by comparing 1° and 2° memory OT-I frequency in PBL for individual mice. (G) 2° memory OT-I phenotype in pooled PBL samples 40 days after re-challenge. Shaded histograms represent isotype controls. Data are representative of two independent experiments.
Figure 6
Figure 6
The quality of 2° CD8+ T-cell responses is independent of 1° memory CD8+ T-cell frequency and phenotype. (A) Experimental design. Indicated numbers of naïve Thy1.1 OT-I T cells were adoptively transferred into naïve Thy1.2 B6 hosts prior to infection with att LM-OVA. At day 60 post 1° infection all groups of mice were challenged with vir LM-OVA. A year after 2° challenge, all group of mice were challenged for the third time with high dose of vir LM-OVA (5 × 10⁵ CFU/mouse). (B) Frequency of 2° memory OT-I T cells (mean+SD; three to four mice per group) in PBL 340 days after 2° infection. (C, D) Peptide-stimulated intracellular cytokine staining of OT-I CD8+ T cells from blood. Numbers represent the percentage of OT-I CD8+ T cells that stain positive for a given cytokine combination. Representative staining is shown. (E) On day 3 post 3° LM challenge bacterial numbers were determined in the spleen. Numbers represent the number of mice that had detectable bacteria. LOD represents the limit of detection. Similar data were also obtained in the liver.

References

    1. Badovinac VP, Porter BB, Harty JT. Programmed contraction of CD8(+) T cells after infection. Nat Immunol. 2002;3:619–626. - PubMed
    1. Butz EA, Bevan MJ. Massive expansion of antigen-specific CD8+ T cells during an acute virus infection. Immunity. 1998;8:167–175. - PMC - PubMed
    1. Schmidt NW, Podyminogin RL, Butler NS, Badovinac VP, Tucker BJ, Bahjat KS, Lauer P, et al. Memory CD8 T cell responses exceeding a large but definable threshold provide long-term immunity to malaria. Proc Natl Acad Sci USA. 2008;105:14017–14022. - PMC - PubMed
    1. Wherry EJ, Teichgraber V, Becker TC, Masopust D, Kaech SM, Antia R, von Andrian UH, Ahmed R. Lineage relationship and protective immunity of memory CD8 T cell subsets. Nat Immunol. 2003;4:225–234. - PubMed
    1. Badovinac VP, Haring JS, Harty JT. Initial T cell receptor transgenic cell precursor frequency dictates critical aspects of the CD8(+) T cell response to infection. Immunity. 2007;26:827–841. - PMC - PubMed

Publication types

MeSH terms