. 2010 Jul;59(7):1674-85.
doi: 10.2337/db09-0986. Epub 2010 Apr 22.

The transcription factor Rfx3 regulates beta-cell differentiation, function, and glucokinase expression

Affiliations

The transcription factor Rfx3 regulates beta-cell differentiation, function, and glucokinase expression

Aouatef Ait-Lounis et al. Diabetes. 2010 Jul.

Abstract

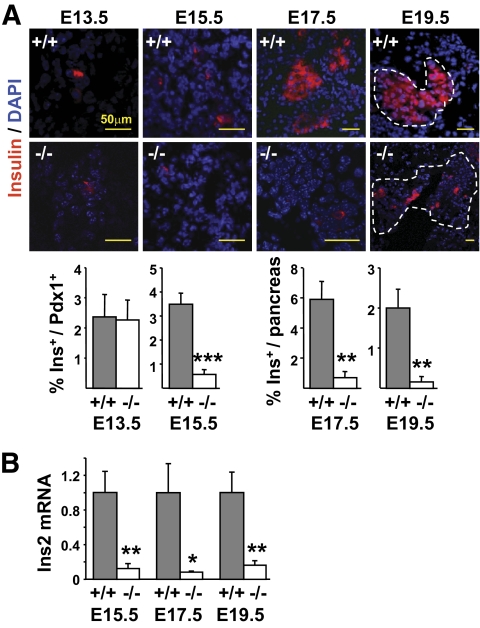
Objective: Pancreatic islets of perinatal mice lacking the transcription factor Rfx3 exhibit a marked reduction in insulin-producing beta-cells. The objective of this work was to unravel the cellular and molecular mechanisms underlying this deficiency.

Research design and methods: Immunofluorescence studies and quantitative RT-PCR experiments were used to study the emergence of insulin-positive cells, the expression of transcription factors implicated in the differentiation of beta-cells from endocrine progenitors, and the expression of mature beta-cell markers during development in Rfx3(-/-) and pancreas-specific Rfx3-knockout mice. RNA interference experiments were performed to document the consequences of downregulating Rfx3 expression in Min6 beta-cells. Quantitative chromatin immunoprecipitation (ChIP), ChIP sequencing, and bandshift experiments were used to identify Rfx3 target genes.

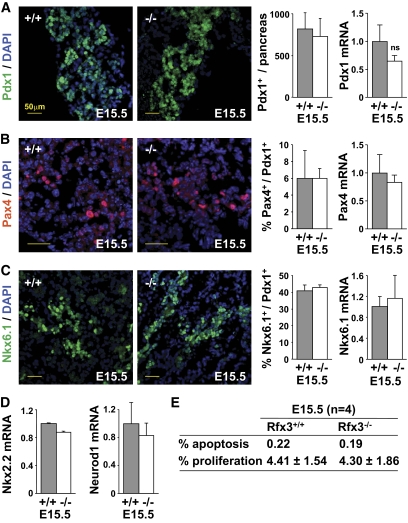
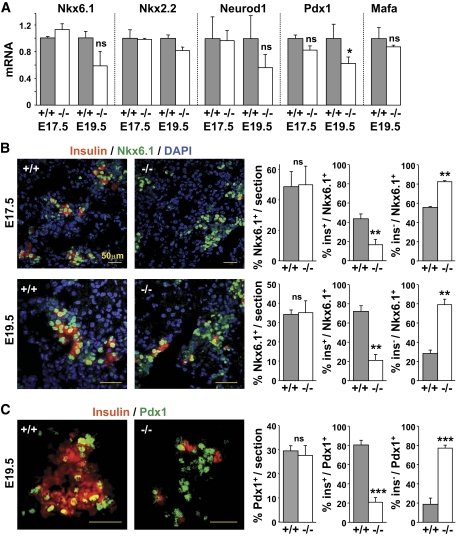
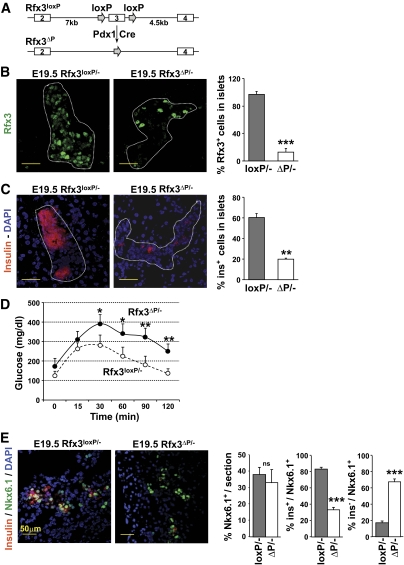
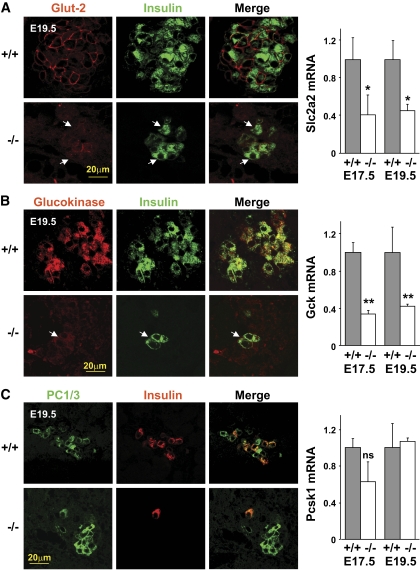
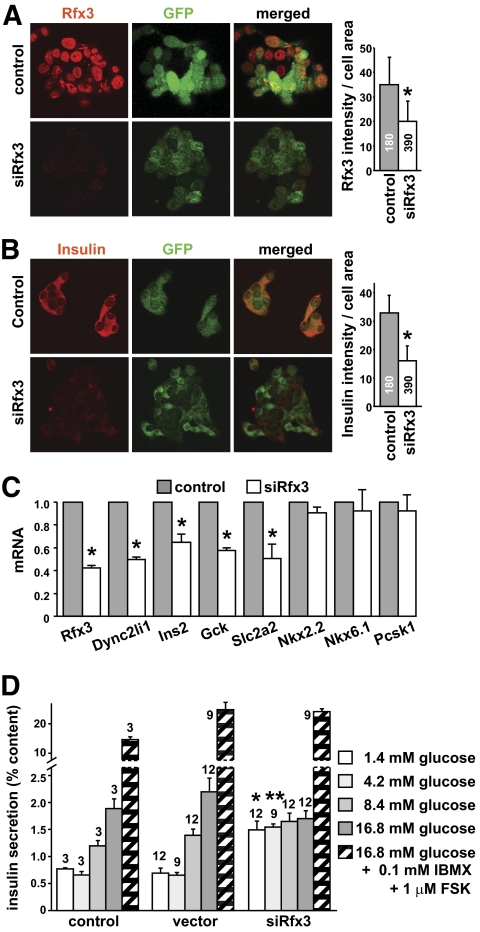
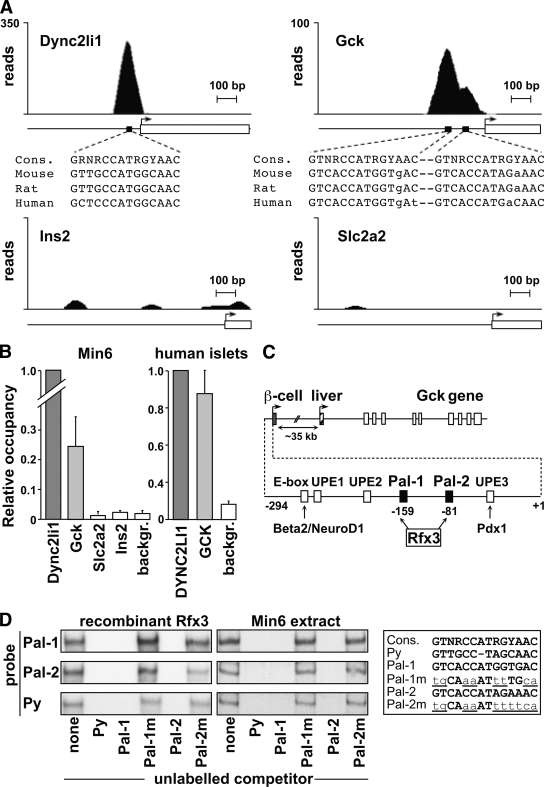
Results: Reduced development of insulin-positive cells in Rfx3(-/-) mice was not due to deficiencies in endocrine progenitors or beta-lineage specification, but reflected the accumulation of insulin-positive beta-cell precursors and defective beta-cells exhibiting reduced insulin, Glut-2, and Gck expression. Similar incompletely differentiated beta-cells developed in pancreas-specific Rfx3-deficient embryos. Defective beta-cells lacking Glut-2 and Gck expression dominate in Rfx3-deficent adults, leading to glucose intolerance. Attenuated Glut-2 and glucokinase expression, and impaired glucose-stimulated insulin secretion, were also induced by RNA interference-mediated inhibition of Rfx3 expression in Min6 cells. Finally, Rfx3 was found to bind in Min6 cells and human islets to two well-known regulatory sequences, Pal-1 and Pal-2, in the neuroendocrine promoter of the glucokinase gene.

Conclusions: Our results show that Rfx3 is required for the differentiation and function of mature beta-cells and regulates the beta-cell promoter of the glucokinase gene.


Figures

FIG. 1.
FIG. 1.
Development of insulin-positive cells is severely impaired in Rfx3/ embryos. A: Pancreas sections from WT (+/+) and Rfx3−/− (−/−) embryos at stages E13.5, E15.5, E17.5, and E19.5 were stained with antibodies against insulin. Nuclei were labeled with DAPI. Representative sections are shown (top). The percentages of insulin-positive cells were quantified in total Pdx1+ cells (E13.5 and E15.5) or in the entire pancreas (E17.5 and E19.5) of WT (+/+) and Rfx3−/− (−/−) embryos (bottom). B: Ins2 mRNA abundance was measured by qRT-PCR in total pancreas RNA from WT (+/+) and Rfx3−/− (−/−) embryos at stages E15.5, E17.5, and E19.5. The results were normalized using Tbp mRNA and are expressed relative to the levels found in WT embryos. The mean ± SEM derived from five embryos is shown for each stage and genotype; ***P < 0.0001; **P < 0.001; *P < 0.05. (A high-quality color representation of this figure is available in the online issue.)
FIG. 2.
FIG. 2.
The expression of key transcription factors implicated in β-cell development is normal in Rfx3−/− embryos. A: Pancreas sections from WT (+/+) and Rfx3−/− (−/−) embryos at stage E15.5 were stained with DAPI and antibodies against Pdx1. Representative sections are shown (left). Pdx1+ cells and Pdx1 mRNA levels were quantified in the pancreases of WT (+/+) and Rfx3−/− (−/−) embryos (right). B: Pancreas sections from WT (+/+) and Rfx3−/− (−/−) embryos at stage E15.5 were stained with DAPI and antibodies against Pax4. Representative sections are shown (left). Pax4+ cells and Pax4 mRNA levels were quantified in the pancreases of WT (+/+) and Rfx3−/− (−/−) embryos (right). Pax4+ cells were expressed as percentage of Pdx1+ cells (counted on serial sections). C: Pancreas sections from WT (+/+) and Rfx3−/− (−/−) embryos at stage E15.5 were stained with DAPI and antibodies against Nkx6.1. Representative sections are shown (left). Nkx6.1+ cells and Nkx6.1 mRNA levels were quantified in the pancreases of WT (+/+) and Rfx3−/− (−/−) embryos (right). Nkx6.1+ cells were expressed as percentage of Pdx1+ cells (counted on serial sections). D: Nkx2.2 and Neurod1 mRNA levels were quantified in total pancreas RNA from WT (+/+) and Rfx3−/− (−/−) embryos at stage E15.5. The results were normalized using Tbp mRNA and are expressed relative to the levels found in WT embryos. The mean ± SEM derived from five embryos is shown for each stage and genotype. ns, not significant. E: TUNEL staining and labeling with anti–phospho-histone H3 antibodies were used to quantify the percentages of apoptotic and proliferating islet cells in pancreatic sections from E15.5 Rfx3+/+ and Rfx3−/− embryos. Means are shown for four embryos of each genotype. (A high-quality color representation of this figure is available in the online issue.)
FIG. 3.
FIG. 3.
Block in β-cell differentiation in Rfx3−/− embryos. A: Nkx6.1, Nkx2.2, Neurod1, Pdx1, and Mafa mRNA levels were quantified in the pancreases of Rfx3+/+ (+/+) and Rfx3−/− (−/−) embryos at stages E17.5 and E19.5. The results were normalized using Tbp mRNA and are expressed relative to the levels found in WT embryos. B: Pancreas sections from WT (+/+) and Rfx3−/− (−/−) embryos at stages E17.5 and E19.5 were co-stained with antibodies against Nkx6.1 and insulin. Nuclei were labeled with DAPI. Representative sections are shown (left). The percentages of total Nkx6.1+ cells, Nkx6.1+insulin+ cells, and Nkx6.1+insulin cells were quantified (right). C: Pancreas sections from WT (+/+) and Rfx3−/− (−/−) embryos at stage E19.5 were co-stained with DAPI and antibodies against Pdx1 and insulin. Representative sections are shown (left). The percentages of total Pdx1+ cells, Pdx1+insulin+ cells, and Pdx1+insulin cells were quantified (right). The mean ± SE derived from five embryos is shown for each stage and genotype; ***P < 0.0001; **P < 0.001; ns, not significant. (A high-quality color representation of this figure is available in the online issue.)
FIG. 4.
FIG. 4.
β-Cell differentiation is impaired in conditional pancreas-specific Rfx3 knockout mice. A: Mice carrying a pancreas-specific deletion of exon 3 of the Rfx3 gene (Rfx3ΔP) were generated by crossing mice carrying an Rfx3 allele in which exon 3 is flanked by loxP sequences (Rfx3loxP) with transgenic mice expressing Cre recombinase under control of the Pdx1 promoter (Pdx1-cre). B: The efficiency of Rfx3 deletion was monitored by staining pancreas sections with antibodies specific for Rfx3. Representative islets (dashed contours) from Rfx3loxP/− and Rfx3ΔP/− E19.5 embryos are shown (left). The bar graph (right) shows quantifications of the percentages of Rfx3+ cells in the islets of Rfx3loxP/− and Rfx3ΔP/− E19.5 embryos. The mean ± SEM derived from five embryos is shown for each genotype; ***P < 0.0001. C: Pancreas sections from Rfx3loxP/− and Rfx3ΔP/− E19.5 embryos were stained with antibodies against insulin. Representative islets (dashed contours) are shown (left). The bar graph (right) shows quantifications of the percentages of insulin-positive cells in the islets of Rfx3loxP/− and Rfx3ΔP/− E19 embryos. The mean ± SEM derived from five embryos is shown for each genotype; **P < 0.001. D: Rfx3ΔP/− mice exhibit impaired glucose tolerance. Blood glucose concentrations were measured in Rfx3loxP/− and Rfx3ΔP/− mice at the indicated times after intraperitoneal injection of glucose. The mean ± SEM is derived from the analysis of five mice of each genotype; *P < 0.05; **P < 0.001. E: Pancreas sections from Rfx3loxP/− and Rfx3ΔP/− embryos at stage E19.5 were co-stained with DAPI and antibodies against Nkx6.1 and insulin. Representative sections are shown (left). The percentages of total Nkx6.1+ cells, Nkx6.1+insulin+ cells, and Nkx6.1+insulin cells were quantified (right). The mean ± SEM derived from five embryos is shown for each stage and genotype; ***P < 0.0001; **P < 0.001; ns, not significant. (A high-quality color representation of this figure is available in the online issue.)
FIG. 5.
FIG. 5.
β-Cells in Rfx3−/− embryos exhibit strongly decreased Glut-2 and glucokinase expression. Pancreas sections from WT (+/+) and Rfx3−/− (−/−) embryos at stage E19.5 were stained with antibodies against insulin and Glut-2 (A), glucokinase (B), or PC1/3 (C). Representative sections are shown (left). Residual insulin-positive cells in Rfx3−/− embryos show only weak Glut-2 and glucokinase expression (arrows). Slc2a2 (A), Gck (B), and Pcsk1 (C) mRNA levels were quantified in the pancreases of WT (+/+) and Rfx3−/− (−/−) embryos at stages E17.5 and E19.5 (right). The results were normalized using Tbp mRNA and are expressed relative to the levels found in WT embryos. The mean ± SEM derived from five embryos is shown for each stage and genotype; **P < 0.001; *P < 0.05; ns, not significant. (A high-quality digital representation of this figure is available in the online issue.)
FIG. 6.
FIG. 6.
Rfx3 is required for maintaining β-cell maturity. Min6 cells were transduced with lentiviral vectors expressing control or Rfx3-specific siRNAs (siRfx3). The vectors also express GFP. A: Transduced cells were stained with antibodies against Rfx3 and examined by fluorescence microscopy to visualize Rfx3 (red) and GFP (green) expression. Representative fields are shown (left). The bar graph (right) shows the quantification of Rfx3 expression (fluorescence intensity). The mean ± SEM was derived from analysis of the indicated numbers of cells; *P < 0.05. B: Transduced cells were stained with antibodies against insulin and examined by fluorescence microscopy to visualize insulin (red) and GFP (green) expression. Representative fields are shown (left). The bar graph (right) shows the quantification of insulin expression (fluorescence intensity). The mean ± SEM was derived from analysis of the indicated numbers of cells; *P < 0.05. C: Rfx3, Dync2li1, Ins2, Gck, Slc2a2, Nkx2.2, Nkx6.1, and Pcsk1 mRNA levels were quantified in cells transduced with the control and Rfx3-specific siRNA vectors. The results were normalized using Tbp mRNA and are expressed relative to cells transduced with the control vector. The mean ± SEM derived from three independent experiments is shown; *P < 0.05. D: Insulin secretion in response to the indicated conditions was measured for Min6 cells transduced with the empty vector (vector), the control siRNA vector (control), or the Rfx3-specific siRNA vector (siRfx3). Results are expressed as percent of total insulin content and show the mean ± SEM derived from the number of measurements indicated at the top of the bars: *P < 0.03, **P < 0.001 vs. corresponding control value. FSK, forskolin; IBMX, isomethyl butyl xanthine. (A high-quality digital representation of this figure is available in the online issue.)
FIG. 7.
FIG. 7.
Rfx3 binds to two key regulatory elements in the β-cell–specific promoter of the Gck gene. A: The profiles show the number of ChIP-seq reads mapping to the upstream regions of the Dync2li1, Gck, Slc2a2, and Ins2 genes. Transcription start sites (arrows), transcribed regions (open boxes), and scales in base pairs (bp) are indicated. Peaks corresponding to binding of Rfx3 were observed in the promoters of the Dync2li1 and Gck genes. The positions of these peaks coincide with conserved Rfx binding motifs (black boxes). The motifs found in the promoters of the mouse, rat, and human Dync2li1 and Gck genes are shown aligned with the consensus Rfx-binding site. No binding of Rfx3 was observed at the promoters of the Ins2 or Slc2a2 genes. B: Binding of Rfx3 to the promoters of the Dync2li1, Gck, Slc2a2, and Ins2 genes was assessed by quantitative ChIP in Min6 cells (left) or purified human islets (right). Control regions were included as background (backgr.) references. Results are expressed relative to binding of Rfx3 at the Dync2li1 promoter and show the mean ± SEM derived from three independent experiments. C: Schematic map of the Gck gene. Transcription of the Gck gene is regulated by two alternative cell type–specific promoters. The first promoter drives Gck expression in β-cells. The second promoter, situated ∼35 kb further downstream, is used in the liver. The two Rfx3 binding sites correspond to the previously identified Pal-1 and Pal-2 sequences centered on nucleotides −159 and −81 of the β-cell promoter. The approximate positions of other known regulatory elements (E-box, UPE-1, UPE-2, UPE-3) and binding sites for transcription factors (Beta2/NeuroD1, Pdx1) implicated in Gck expression in β-cells are indicated. The map of the Gck promoter is based on the study by Im et al. (36). D: Bandshift experiments were performed with recombinant Rfx3 (left gels) and Min6 extracts (right gels) using double-stranded oligonucleotide probes containing Pal-1, Pal-2, and a known Rfx binding site (Py) from the polyoma-virus enhancer. The regions of the gels containing the major band corresponding to binding of Rfx3 are shown (see supplementary Fig. 11). Binding reactions were supplemented as indicated below with unlabeled competitor oligonucleotides containing the Py, Pal-1, mutated Pal-1 (Pal-1m), Pal-2, or mutated Pal-2 (Pal-2m) sites. The corresponding sequences are shown aligned with the consensus Rfx binding site. Mutated nucleotides are underlined and in lower case.

References

    1. Gradwohl G, Dierich A, LeMeur M, Guillemot F: Neurogenin3 is required for the development of the four endocrine cell lineages of the pancreas. Proc Natl Acad Sci U S A 2000;97:1607–1611 - PMC - PubMed
    1. Johansson KA, Dursun U, Jordan N, Gu G, Beermann F, Gradwohl G, Grapin-Botton A: Temporal control of neurogenin3 activity in pancreas progenitors reveals competence windows for the generation of different endocrine cell types. Dev Cell 2007;12:457–465 - PubMed
    1. Oliver-Krasinski JM, Stoffers DA: On the origin of the beta cell. Genes Dev 2008;22:1998–2021 - PMC - PubMed
    1. Naya FJ, Huang HP, Qiu Y, Mutoh H, DeMayo FJ, Leiter AB, Tsai MJ: Diabetes, defective pancreatic morphogenesis, and abnormal enteroendocrine differentiation in BETA2/neuroD-deficient mice. Genes Dev 1997;11:2323–2334 - PMC - PubMed
    1. Prado CL, Pugh-Bernard AE, Elghazi L, Sosa-Pineda B, Sussel L: Ghrelin cells replace insulin-producing beta cells in two mouse models of pancreas development. Proc Natl Acad Sci U S A 2004;101:2924–2929 - PMC - PubMed

Publication types

MeSH terms