

Is the recent rise in type 2 diabetes incidence from 1984 to 2007 explained by the trend in increasing BMI?: evidence from a prospective study of British men
- PMID: 20413526
- PMCID: PMC2890347
- DOI: 10.2337/dc09-2295
Is the recent rise in type 2 diabetes incidence from 1984 to 2007 explained by the trend in increasing BMI?: evidence from a prospective study of British men
Abstract
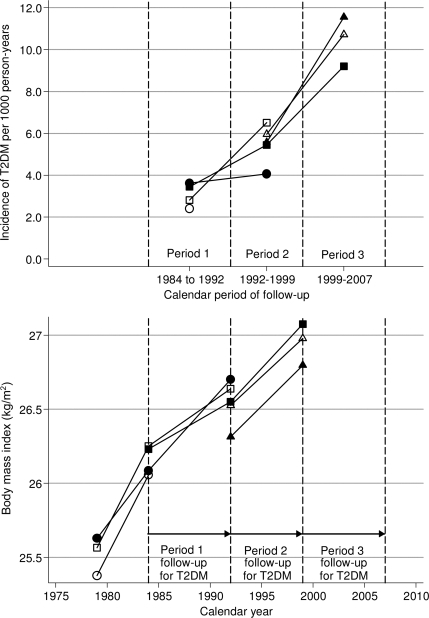
Objective: To estimate the extent to which increasing BMI may explain the rise in type 2 diabetes incidence in British men from 1984 to 2007.
Research design and methods: A representative cohort ratio of 6,460 British men was followed-up for type 2 diabetes incidence between 1984 (aged 45-65 years) and 2007 (aged 67-89 years). BMI was ascertained at regular intervals before and during the follow-up.
Results: Between 1984-1992 and 1999-2007, the age-adjusted hazard of type 2 diabetes more than doubled (hazard ratio 2.33 [95% CI 1.75-3.10]). Mean BMI rose by 1.42 kg/m(2) (95% CI 1.10-1.74) between 1984 and 1999; this could explain 26% (95% CI 17-38) of the type 2 diabetes increase.
Conclusions: An appreciable portion of the rise in type 2 diabetes can be attributed to BMI changes. A substantial portion remains unexplained, possibly associated with other determinants such as physical activity. This merits further research.
Figures
References
-
- Masso-González EL, Johansson S, Wallander MA, Garcia-Rodríguez LA: Trends in the prevalence and incidence of diabetes in the UK: 1996 to 2005. J Epidemiol Community Health 2009; 63: 332–336 - PubMed
-
- Fox CS, Pencina MJ, Meigs JB, Vasan RS, Levitzky YS, D'Agostino RB, Sr: Trends in the incidence of type 2 diabetes mellitus from the 1970s to the 1990s: the Framingham Heart Study. Circulation 2006; 113: 2914–2918 - PubMed
-
- Silventoinen K, Sans S, Tolonen H, Monterde D, Kuulasmaa K, Kesteloot H, Tuomilehto J. WHO MONICA Project. Trends in obesity and energy supply in the WHO MONICA Project. Int J Obes Relat Metab Disord 2004; 28: 710–718 - PubMed
-
- Flegal KM, Carroll MD, Ogden CL, Johnson CL: Prevalence and trends in obesity among US adults, 1999–2000. JAMA 2002; 288: 1723–1727 - PubMed
-
- Health Survey for England 2004 [article online], 2005. Available from http://www.ic.nhs.uk/statistics-and-data-collections/health-and-lifestyl.... Accessed 9 June 2009
Publication types
MeSH terms
Grants and funding
LinkOut - more resources
Full Text Sources
Medical
