. 2010 Jun;16(6):1108-17.
doi: 10.1261/rna.1988510. Epub 2010 Apr 22.

Evaluation of the information content of RNA structure mapping data for secondary structure prediction

Affiliations

Evaluation of the information content of RNA structure mapping data for secondary structure prediction

Scott Quarrier et al. RNA. 2010 Jun.

Abstract

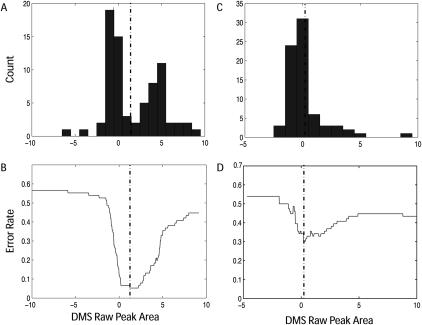
Structure mapping experiments (using probes such as dimethyl sulfate [DMS], kethoxal, and T1 and V1 RNases) are used to determine the secondary structures of RNA molecules. The process is iterative, combining the results of several probes with constrained minimum free-energy calculations to produce a model of the structure. We aim to evaluate whether particular probes provide more structural information, and specifically, how noise in the data affects the predictions. Our approach involves generating "decoy" RNA structures (using the sFold Boltzmann sampling procedure) and evaluating whether we are able to identify the correct structure from this ensemble of structures. We show that with perfect information, we are always able to identify the optimal structure for five RNAs of known structure. We then collected orthogonal structure mapping data (DMS and RNase T1 digest) under several solution conditions using our high-throughput capillary automated footprinting analysis (CAFA) technique on two group I introns of known structure. Analysis of these data reveals the error rates in the data under optimal (low salt) and suboptimal solution conditions (high MgCl(2)). We show that despite these errors, our computational approach is less sensitive to experimental noise than traditional constraint-based structure prediction algorithms. Finally, we propose a novel approach for visualizing the interaction of chemical and enzymatic mapping data with RNA structure. We project the data onto the first two dimensions of a multidimensional scaling of the sFold-generated decoy structures. We are able to directly visualize the structural information content of structure mapping data and reconcile multiple data sets.


Figures

FIGURE 1.
FIGURE 1.
(A) Crystal structure representation of the P4P6 subdomain of the T. thermophila group I intron (PDB ID 1GID). In this study we used the secondary structure derived from the crystal structure as a reference as determined by NDB (Berman et al. 2002) excluding all tertiary contacts. (B) Secondary structure derived from the P4P6 crystal structure used as a reference. The PPV and sensitivity of the structure are 1 and it has a Manhattan distance of 0 since it is the reference structure. (C) sFold decoy with lowest Manhattan distance and greatest sum of PPV and sensitivity found in the 106 decoys that we generated for this analysis. (D) sFold decoy with the largest Manhattan distance and low PPV and sensitivity.
FIGURE 2.
FIGURE 2.
(A) Plot of the sum of PPV and sensitivity to the reference crystal structure as a function of the Manhattan distance to perfect information (ideal) data for 1,000,000 P4P6 decoys generated by sFold (Ding et al. 2005). (B) Similar plot computing the Manhattan distance to the experimentally obtained DMS chemical mapping data at 100 mM KCl for the P4P6 domain of the Tetrahymena group I intron. The lowest distance decoy is indicated with a red box, the MFE structure with a blue box, and the crystal (reference) is in green.
FIGURE 3.
FIGURE 3.
(A) Histogram of the raw DMS peak areas for adenines and cytosines for the Tetrahymena group I intron at 100 mM KCl. The distribution of peak areas is bimodal with several outliers. Some of the very negative and positive values are a result of RT stops that yield very large peak areas that is one source of noise in the data. (B) Error rate as a function of threshold when predicting paired/unpaired bases using as the reference the crystal structure (PDB ID 1GID). The dotted vertical line identifies an optimal threshold above which bases are considered unpaired (high DMS reactivity). (C) Same histogram as in A, however, for data collected in the presence of 10 mM MgCl2. (D) Error rate as a function of threshold for data collected in the presence of 10 mM MgCl2. An optimal threshold value can be found, but it is not apparent from the histogram (C).
FIGURE 4.
FIGURE 4.
(A) Multidimensional scaling of 5000 P4P6 RNA decoys generated by sFold and projected onto the first two dimensions as black dots. The green square is the reference (crystal) structure projected onto the two dimensions. The red dots represent the top 30 equidistant structures to the P4P4 DMS data collected at 100 mM KCl, while the blue squares represent the same selection for the 10 mM MgCl2 data computed using the Manhattan distance metric. The magenta diamonds represent the same selection for the 100 mM T1 data. (B) Same decoys as in A; however, in this case we directly projected the structure mapping data onto the first two dimensions. The green square represents the crystal (reference) structure, while the red data represent repeats of the 100 mM KCl DMS, blue 10 mM MgCl2, and magenta 100 mM KCl T1 data.

References

    1. Adilakshmi T, Lease RA, Woodson SA 2006. Hydroxyl radical footprinting in vivo: Mapping macromolecular structures with synchrotron radiation. Nucleic Acids Res 34: e64 doi: 10.1093/nar/gkl1291 - PMC - PubMed
    1. Bartley LE, Zhuang X, Das R, Chu S, Herschlag D 2003. Exploration of the transition state for tertiary structure formation between an RNA helix and a large structured RNA. J Mol Biol 328: 1011–1026 - PubMed
    1. Berman HM, Westbrook J, Feng Z, Iype L, Schneider B, Zardecki C 2002. The Nucleic Acid Database. Acta Crystallogr D Biol Crystallogr 58: 889–898 - PubMed
    1. Bernhart SH, Hofacker IL, Stadler PF 2006. Local RNA base pairing probabilities in large sequences. Bioinformatics 22: 614–615 - PubMed
    1. Brunel C, Romby P 2000. Probing RNA structure and RNA-ligand complexes with chemical probes. Methods Enzymol 318: 3–21 - PubMed

Publication types

LinkOut - more resources