. 2010 Jun;176(6):2682-94.
doi: 10.2353/ajpath.2010.091234. Epub 2010 Apr 22.

Fingolimod (FTY720) enhances remyelination following demyelination of organotypic cerebellar slices

Affiliations

Fingolimod (FTY720) enhances remyelination following demyelination of organotypic cerebellar slices

Veronique E Miron et al. Am J Pathol. 2010 Jun.

Abstract

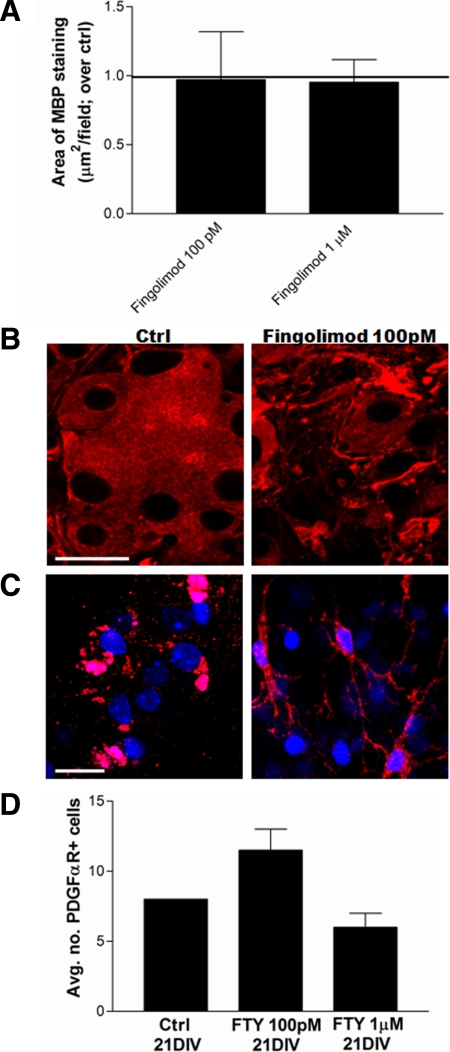
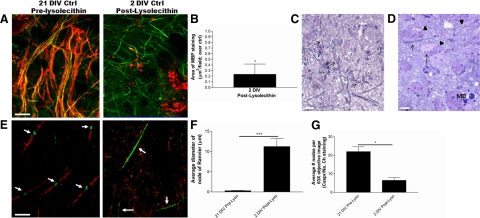
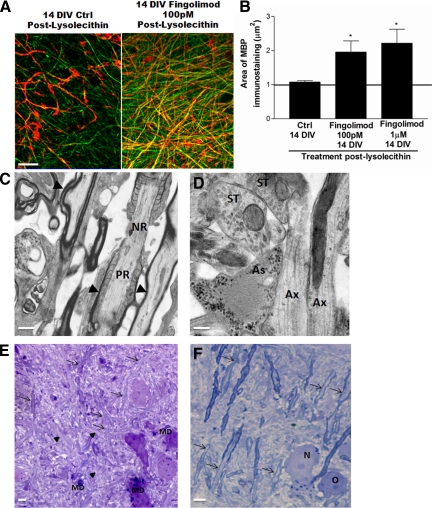
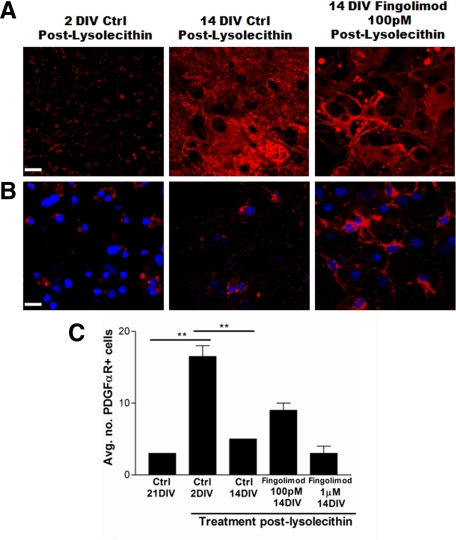
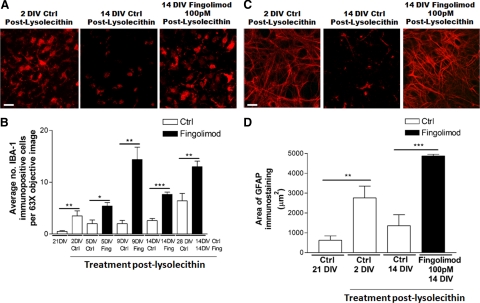
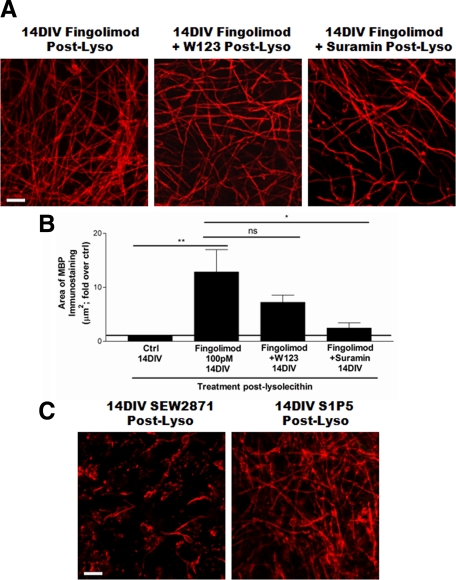
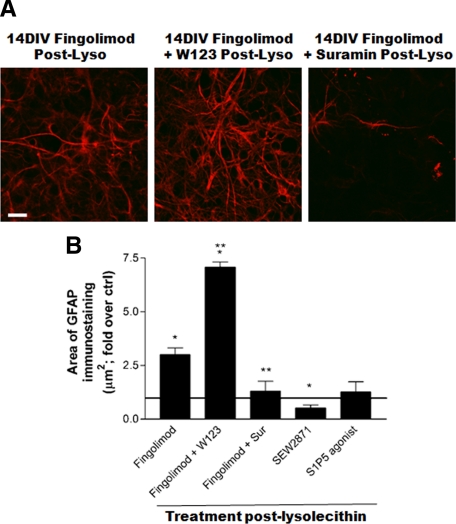
Remyelination, which occurs subsequent to demyelination, contributes to functional recovery and is mediated by oligodendrocyte progenitor cells (OPCs) that have differentiated into myelinating cells. Therapeutics that impact remyelination in the CNS could be critical determinants of long-term functional outcome in multiple sclerosis (MS). Fingolimod is a S1P receptor modulator in MS clinical trials due to systemic anti-inflammatory properties, yet may impact cells within the CNS by crossing the blood-brain barrier. Previous studies using isolated dissociated cultures indicate that neural cells express S1P receptors and respond to receptor engagement. Our objective was to assess the effects of fingolimod on myelin-related processes within a multicellular environment that maintains physiological cell-cell interactions, using organotypic cerebellar slice cultures. Fingolimod treatment had no impact on myelin under basal conditions. Fingolimod treatment subsequent to lysolecithin-induced demyelination enhanced remyelination and process extension by OPCs and mature oligodendrocytes, while increasing microglia numbers and immunoreactivity for the astrocytic marker glial fibrillary acidic protein. The number of phagocytosing microglia was not increased by fingolimod. Using S1P receptor specific agonists and antagonists, we determined that fingolimod-induced effects on remyelination and astrogliosis were mediated primarily through S1P3 and S1P5, whereas enhanced microgliosis was mediated through S1P1 and S1P5. Taken together, these data demonstrate that fingolimod modulates multiple neuroglial cell responses, resulting in enhanced remyelination in organotypic slice cultures that maintain the complex cellular interactions of the mammalian brain.


Figures

Figure 1
Figure 1
Effect of fingolimod on myelin and oligodendroglial lineage cells under nonpathological conditions. A: Quantification of amount of myelin expressed as area of MBP immunostaining (μm2) per ×63 objective image normalized to untreated control culture values at 35 days in vitro (DIV). Treatment with fingolimod (100 pmol/L, 1 μmol/L) for 21 DIV did not significantly affect the amount of myelin in the cultures. B: Representative confocal images of organotypic cerebellar slice cultures at 35 DIV immunostained against the oligodendrocyte marker, neurite outgrowth inhibitor protein A (NogoA; red). Untreated cultures were characterized by NogoA positive mature oligodendrocytes that demonstrated some membrane fusion. Treatment with fingolimod (100 pmol/L) for 21 DIV induced process outgrowth and membrane elaboration of NogoA positive cells relative to control. Scale bar = 20 μm. C: Representative confocal images of organotypic cerebellar slices at 35 DIV immunostained against the oligodendrocyte progenitor cell (OPC) marker platelet-derived growth factor receptor α (PDGFαR; red) and counterstained with the nuclear Topro-3 (blue). Some immunopositive cells were observed in untreated cultures. Treatment with fingolimod (100 pmol/L) for 21 DIV caused process outgrowth in OPCs. Scale bar = 20 μm. D: Quantification of absolute numbers of PDGFαR+ OPCs per ×63 objective image represented as average ± SEM, at 35 DIV. There was a trend increase in OPC numbers with 100 pmol/L fingolimod treatment for 21 DIV.
Figure 2
Figure 2
Characteristics of lysolecithin-induced demyelination of slices. A: Representative images of slices at 21 DIV (pre-demyelination) and 2 DIV postlysolecithin induced demyelination (23 DIV total), immunostained against myelin (MBP; red) and axons (NFM; green). Following lysolecithin treatment, MBP immunostaining is not associated with axons and likely reflects myelin debris. Scale bar = 20 μm. B: Quantification of amount of myelin expressed as area of MBP immunostaining (μm2) per ×63 objective image normalized to untreated control culture values at 21 DIV. Treatment with lysolecithin decreased the area of MBP staining. *P < 0.05. C: Representative toluidine-blue stained section of culture at 21DIV before demyelination. Arrows indicate myelinated fibers. Scale bar =5 μm. D: Representative toluidine-blue stained section of lysolecithin-treated culture 2 DIV postdemyelination demonstrates some residually myelinated fibers (short arrow), many demyelinated axons (arrowheads), and some neurons showing some degenerative changes (long arrow). Myelin debris in the form of small blue stained collections and granules is seen both within and outside of cells (MD). Scale bar = 5 μm. E: Immunostaining of cultures pre-lysolecithin at 21 DIV demonstrates paranodal protein Caspr (red) flanking nodal aggregations of sodium channels (green), suggestive of proper node of Ranvier formation (arrows). Lysolecithin-induced demyelination induced a dispersion of Caspr immunostaining (red) and expansion of sodium channels along the axon (green; arrows). Scale bar = 10 μm. F: Average diameter of nodes of Ranvier (μm) as measured by length of sodium channel aggregation ± SEM, in cultures at 21 DIV (pre-lysolecithin) or 2 DIV postlysolecithin-induced demyelination. Demyelination induced a significant increase in the length of the node due to lateral migration of sodium channels. ***P < 0.001. G: Average number of nodes of Ranvier per ×63 objective image ± SEM, in cultures at 21 DIV (pre-lysolecithin) or 2 DIV postlysolecithin-induced demyelination. Demyelination induced a significant decrease in the number of nodes of Ranvier. *P < 0.05.
Figure 3
Figure 3
Effects of fingolimod on remyelination following lysolecithin-induced demyelination. A: Representative images of demyelinated slices, control or treated with fingolimod (100 pmol/L) for 14 DIV postlysolecithin, immunostained against myelin (MBP; red) and axons (NFM; green). Fingolimod increases the amount of myelin associated with axons compared with control. Scale bar = 20 μmol/L. B: Quantification of amount of myelin expressed as area of MBP immunostaining (μm2) per ×63 objective image normalized to control culture values at 14 DIV postlysolecithin. Fingolimod treatment (100 pmol/L, 1 μmol/L) for 14 DIV postlysolecithin significantly increases the amount of myelin compared with control cultures. *P < 0.05. C: Electron micrograph of demyelinated slice treated with 100 pmol/L fingolimod for 14 DIV postdemyelination indicates thin myelin sheaths (arrows) suggestive of remyelination. Thin myelin sheaths at the paranode (PR) adjacent to the node of Ranvier (NR) are suggestive functional remyelination. Scale bar =1 μm. D: Electron micrograph of demyelinated slice treated with 100 pmol/L fingolimod for 14 DIV postdemyelination indicates maintenance of appropriate cytoarchitecture, with synaptic terminals (ST) onto an axon (Ax) complete with synaptic vesicles, with an adjacent astrocyte (As) likely mediating homeostatic functions at the synapse. Scale bar = 0.5 μm. E: Toluidine-blue stained image of demyelinated slice allowed to recover for 14DIV postdemyelination. Arrowheads indicate demyelinated axons. Arrows indicate thin myelin sheaths suggestive of remyelination. Scale bar = 5 μm. MD, myelin debris F: Toluidine-blue stained image of demyelinated slice treated with 100 pmol/L fingolimod for 14 DIV postdemyelination demonstrates a healthy neuron (N) and oligodendrocyte (O), as well as many thin myelin sheaths (arrows) indicating remyelination. Scale bar = 5 μm.
Figure 4
Figure 4
Effects of fingolimod on oligodendroglial lineage cells under remyelinating conditions. A: Representative images of mature oligodendrocytes immunostained against NogoA (red). Cultures at 2 DIV postlysolecithin demonstrate a loss of NogoA immunoreactivity; control cultures at 14 DIV postlysolecithin show some recovery of NogoA immunostaining. Fingolimod treatment for 14 DIV postlysolecithin induces extension of processes in mature oligodendrocytes relative to control. Scale bar = 20 μm. B: Representative images of OPCs immunostained against PDGFαR (red) and counterstained with the nuclear dye Topro-3 (blue) demonstrate an increase in OPC numbers in cultures 2 DIV postlysolecithin, and a subsequent decrease in control cultures at 14 DIV postlysolecithin likely representing differentiation and loss of the marker. Process extension was observed in OPCs in cultures treated with fingolimod for 14 DIV postlysolecithin. Scale bar = 20 μm. C: Quantification of absolute numbers of PDGFαR immunopositive OPCs per ×63 objective image ± SEM. At 2 DIV postlysolecithin, numbers of OPCs are significantly increased compared with pre-lysolecithin (control 21 DIV). These numbers subsequently decrease by 14 DIV postlysolecithin in control cultures. Fingolimod treatment (100 pmol/L) for 14 DIV postlysolecithin induced a trend toward an increase in OPC numbers. **P < 0.01.
Figure 5
Figure 5
Effects of fingolimod on microglia and astrocytes under remyelinating conditions. A: Representative images of slices at 35 DIV immunostained against the microglial marker IBA-1 (red). Microglia are increased at 2 DIV postlysolecithin and subsequently decrease by 14 DIV. Cultures treated with fingolimod (100 pmol/L) for 14 DIV postlysolecithin show relatively increased numbers of microglia relative to control cultures. Scale bar = 20 μm. B: Quantification of numbers of microglia represented as average IBA-1 immunopositive cells per ×63 objective image ± SEM. Microglia cell numbers are increased by 2 DIV postlysolecithin, which subsides by 5 DIV. Fingolimod-treated cultures (Fing; black bars) showed a significant increase in microglia cell numbers at 5, 9, and 14DIV postdemyelination compared with controls (Ctrl; white bars). Delaying 14 DIV fingolimod treatment for 2 weeks following lysolecithin treatment still induced an increase in microglia cell numbers in comparison with control cultures at 28 DIV postlysolecithin. *P < 0.05, **P < 0.01, ***P < 0.001. C: Representative images of slices at 35 DIV immunostained against the astrocytic marker GFAP (red). Astrocytes are increased at 2 DIV postlysolecithin and subsequently decrease by 14 DIV. Cultures treated with fingolimod (100 pmol/L) for 14 DIV postlysolecithin show relatively increased GFAP immunostaining relative to control cultures. Scale bar = 20 μm. D: Quantification of astrocytes represented as area of GFAP immunostaining (μm2) ± SEM. Demyelination with lysolecithin (2 DIV postlysolecithin) induces an increase in GFAP staining compared with pre-demyelination controls (21 DIV). In 14 DIV postlysolecithin control cultures, GFAP staining shows a relative decrease compared with 2 DIV postlysolecithin. Fingolimod treatment (100 pmol/L) for 14 DIV postlysolecithin induces an increase in GFAP staining, as compared with control. **P < 0.01, ***P < 0.001.
Figure 6
Figure 6
Mechanism of fingolimod-mediated effects on remyelination. A: Representative images of myelin (MBP) in cultures at 14 DIV postdemyelination, treated with fingolimod (100 pmol/L) alone, or co-treated with a S1P1 receptor antagonist W123 or a S1P3/5 pathway antagonist suramin. Scale bar = 20 μm. B: Quantification of amount of myelin expressed as area of MBP immunostaining (μm2) per ×63 objective image normalized to control culture values at 14 DIV postlysolecithin. The increased remyelination observed with fingolimod treatment (100 pmol/L) for 14 DIV postlysolecithin was slightly decreased with W123 co-treatment, yet was only significantly reversed with suramin supplementation. *P < 0.05, **P < 0.01. C: Representative images of cultures treated with specific S1P receptor agonists for 14 DIV following demyelination. The S1P1 agonist SEW2871 (100 nmol/L) caused a decrease in the amount of myelin associated with axons and increase of myelin debris. A S1P5 agonist (100 nmol/L) induced trend increases in remyelination. Scale bar = 20 μm.
Figure 7
Figure 7
Mechanism of fingolimod-induced effects on astrocytes. A: Representative images of GFAP immunostaining of cultures at 14 DIV postdemyelination. The increase in GFAP immunostaining observed with fingolimod treatment (100 pmol/L) was further increased when the S1P1 antagonist W123 was supplemented to the cultures, suggesting a disinhibition of S1P3/5-associated signaling. Accordingly, suramin supplementation significantly decreased the area of GFAP immunostaining compared with fingolimod alone. Scale bar = 20 μm. B: Quantification of the astrocytic response represented as area of GFAP immunostaining (μm2) normalized to control at 14 DIV postdemyelination. Fingolimod-induced increase in values were significantly increased by W123 and reversed with suramin. The S1P1 agonist SEW2871 (100 nmol/L) significantly decreased GFAP immunostaining, as compared with control, whereas a S1P5 agonist (100 nmol/L) had no significant effect. *P < 0.05, **P < 0.01.

Comment in

References

    1. Griffiths I, Klugmann M, Anderson T, Yool D, Thomson C, Schwab MH, Schneider A, Zimmermann F, McCulloch M, Nadon N, Nave KA. Axonal swellings and degeneration in mice lacking the major proteolipid of myelin. Science. 1998;280:1610–1613. - PubMed
    1. Lappe-Siefke C, Goebbels S, Gravel M, Nicksch E, Lee J, Braun PE, Griffiths IR, Nave KA. Disruption of Cnp1 uncouples oligodendroglial functions in axonal support and myelination. Nat Genet. 2003;33:366–374. - PubMed
    1. Yin X, Baek RC, Kirschner DA, Peterson A, Fujii Y, Nave KA, Macklin WB, Trapp BD. Evolution of a neuroprotective function of central nervous system myelin. J Cell Biol. 2006;172:469–478. - PMC - PubMed
    1. Lajtha A, Toth J, Fujimoto K, Agrawal HC. Turnover of myelin proteins in mouse brain in vivo. Biochem J. 1977;164:323–329. - PMC - PubMed
    1. LeBaron FN, Sanyal S, Jungalwala FB. Turnover rate of molecular species of sphingomyelin in rat brain. Neurochem Res. 1982;6:1081–1089. - PubMed

Publication types

MeSH terms