. 2010 Apr 22;464(7292):1155-60.
doi: 10.1038/nature08935.

Lateral competition for cortical space by layer-specific horizontal circuits

Affiliations

Lateral competition for cortical space by layer-specific horizontal circuits

Hillel Adesnik et al. Nature. .

Abstract

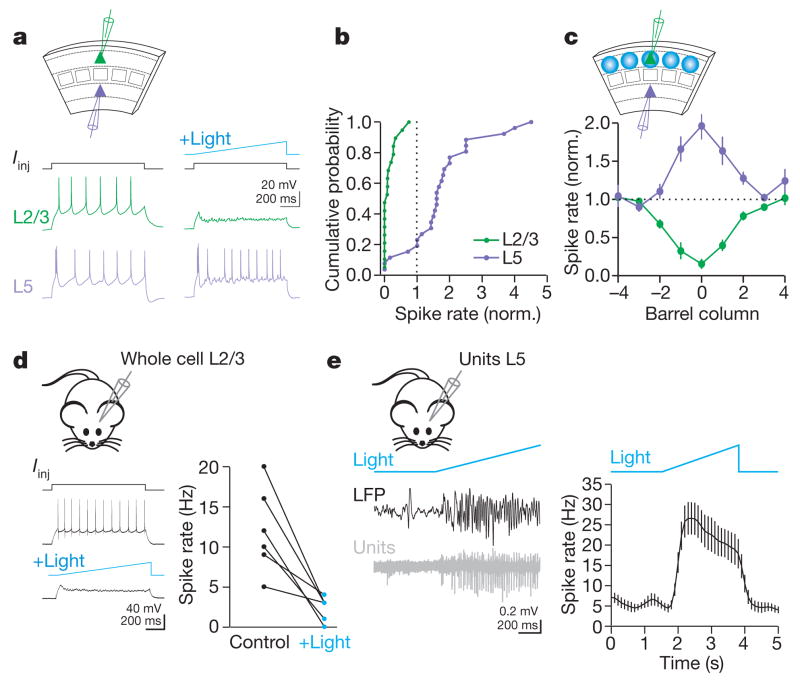
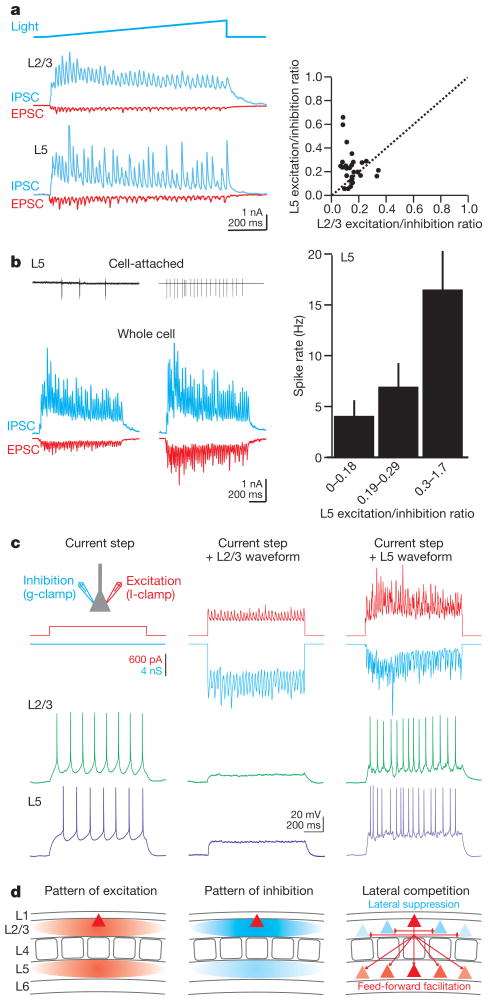
The cerebral cortex constructs a coherent representation of the world by integrating distinct features of the sensory environment. Although these features are processed vertically across cortical layers, horizontal projections interconnecting neighbouring cortical domains allow these features to be processed in a context-dependent manner. Despite the wealth of physiological and psychophysical studies addressing the function of horizontal projections, how they coordinate activity among cortical domains remains poorly understood. We addressed this question by selectively activating horizontal projection neurons in mouse somatosensory cortex, and determined how the resulting spatial pattern of excitation and inhibition affects cortical activity. We found that horizontal projections suppress superficial layers while simultaneously activating deeper cortical output layers. This layer-specific modulation does not result from a spatial separation of excitation and inhibition, but from a layer-specific ratio between these two opposing conductances. Through this mechanism, cortical domains exploit horizontal projections to compete for cortical space.


Figures

Figure 1
Figure 1. Photoinduced gamma activity in vivo and in vitro
a, The top panel shows a schematic of a layer 2/3 pyramidal cell axon. The bottom panel shows anti-GFP immunostaining of the barrel cortex expressing ChR2 and GFP. b, A light ramp (blue, 1-s duration) induced oscillations of the local field potential (LFP, high-pass filtered at 0.5 Hz; top trace, black) and of unit activity (bottom trace, grey; LFP high-pass filtered at 100 Hz) recorded in layer 2/3 in vivo. The LFP in the grey box is expanded below. c, LFP power spectrum shown in b before (grey) and during (black) the light stimulus. d, In vivo recording of a layer 2/3 pyramidal cell during light stimulation. Top traces: red, excitation recorded at −70 mV. Blue, inhibition recorded at +10 mV. Baseline holding current has been subtracted. Bottom traces: expanded section of the traces in the grey box. e, Simultaneous recording of two layer 2/3 pyramidal cells in vitro during light stimulation. Top traces: red, excitation recorded at −70 mV in one cell; blue, inhibition recorded at +10 mV simultaneously in the other cell. Bottom traces: expanded section of traces in the grey box. f, Average peak frequency between 20 and 60 Hz (± s.e.m.) of the light-induced oscillations recorded in vivo (n =16) and in vitro (n =65; P =0.004).
Figure 2
Figure 2. Vertical match of excitation and inhibition across layers
a, Recording configuration. b, EPSCs (left) and IPSCs (right) recorded simultaneously in L2/3, L4, L5 and L6 principal cells. c, Power spectra of the EPSCs (top) and IPSCs (bottom) for currents recorded in layer 2/3 and layer 5 pyramidal cells (from b). Insets show power spectra for layer 4 and 6 neurons; the y axis of the insets is expanded as compared to the main y axis. d, Average normalized charge (± s.e.m.) for simultaneously recorded cells across cortical layers. In each recording, one of the cells was a layer 2/3 pyramidal cell for normalization (EPSC charge, P <10−6: L2/3 (n =58), L4 (n =16), L5 (n =34), L6 (n =15); IPSC charge, P <10−7: L2/3 (n =53), L4 (n =16), L5 (n =32), L6 (n =13); one way ANOVA). e, Average normalized power (± s.e.m.) between 20–60 Hz for photoinduced oscillations across cortical layers (EPSC power, P <10−7: L2/3 (n =46), L4 (n =15), L5 (n =20), L6 (n =14); IPSC power, P <10−3: L2/3 (n =53), L4 (n =15), L5 (n =30), L6 (n =13); one way ANOVA).
Figure 3
Figure 3. Horizontal match of excitation and inhibition within layers
a, The recording configuration is shown at the top left. Blue and red traces indicate IPSCs and EPSCs, respectively, recorded in a layer 2/3 pyramidal cell in response to focal light stimulation translated tangentially across barrel columns. Numbers below traces indicate distance (in barrel columns) of the light-stimulated barrel column with respect to the home barrel column (position 0). The inset to the right shows normalized charge (excitation in red and inhibition in blue) plotted against distance. b, Plots of average charge (left) and power between 20–60 Hz (right) against distance in layer 2/3 pyramidal cells (n =19). c, Same as b but for layer 5 pyramidal cells (n =12). d, Top panel: recording configuration at the edge of barrel cortex. Middle and bottom panels: average charge plotted against distance (in micrometres) between the recorded neuron and the centre of light stimulus when the stimulus was on barrel cortex (open circles) or on adjacent somatosensory non-barrel cortex (closed circles). Red indicates excitation (n =10); blue indicates inhibition (n =10). In all plots error bars are ± s.e.m.
Figure 4
Figure 4. Lateral suppression and feed-forward facilitation in vivo and in vitro
a, Response of simultaneously recorded layer 2/3 (green) and layer 5 (purple) pyramidal cells to current injection (Iinj) without (left) and with (right) light stimulation. b, Cumulative probability plot of the normalized spike rate (spike rate with light stimulus divided by the spike rate in control: layer 2/3, green (n =11); layer 5, purple (n =20); P <0.001, Kolmogorov–Smirnov test). c, Normalized spike rate of layer 2/3 (green, n =8) and layer 5 (purples, n =6) pyramidal cells plotted against barrel-column distance from focal light stimulation. Error bars are ± s.e.m. d, The left panel shows in vivo response of layer 2/3 neuron to current injection (Iinj) without (top) and with (bottom, digitally subtracted bridge) light stimulation. The right panel shows a summary plot (n =6). e, The left panel shows LFP (top trace, black, high-pass filtered at 1 Hz) and unit activity (bottom trace, grey; LFP high-pass filtered at 300 Hz) recorded in layer 5 in vivo in response to light stimulation. The right panel shows average time course of spike rate of seven similar experiments. Error bars are ± s.e.m.
Figure 5
Figure 5. Layer-specific excitation/inhibition ratio
a, The left panel shows simultaneous recording of layer 2/3 (top) and layer 5 (bottom) pyramidal cells during light stimulation (EPSCs in red and IPSCs in blue). The right panel shows scatter plot of excitation/inhibition ratio for all layer 2/3 and layer 5 cell pairs (n =30; P =0.018). b, The left panel shows cell-attached (top) and subsequent whole-cell recordings (bottom) from a pair of layer 5 pyramidal cells during light stimulation. The right panel shows binned distribution of spike rate versus excitation/inhibition ratio for 35 layer 5 pyramidal cells (the bins contain, from left to right: 12, 12 and 11 pairs). Error bars are ± s.e.m. c, The top panel shows recording configuration and injected waveforms. One pipette imposes an inhibitory conductance (blue; g-clamp). The other pipette injects an excitatory current waveform (red, I-clamp). The left panel shows the square depolarizing current step used to elicit baseline spiking; no inhibitory conductance. Middle and right panels show inhibitory conductance (blue) and excitatory current (red) waveforms, recorded in a layer 2/3 pyramidal cell (middle) and in a layer 5 pyramidal cell (right). The bottom panel shows response of a layer 2/3 (green) and a layer 5 (purple) pyramidal cell to the current step and waveforms illustrated above. d, Schematic of the spatial overlap between excitation (left) and inhibition (centre) across and within layers. The resulting lateral suppression within layer 2/3 and feed-forward excitation of layer 5 leads to the lateral expansion of a cortical domain at the expense of its neighbours (right).

Comment in

References

    1. Binzegger T, Douglas RJ, Martin KA. A quantitative map of the circuit of cat primary visual cortex. J Neurosci. 2004;24:8441–8453. - PMC - PubMed
    1. Gottlieb JP, Keller A. Intrinsic circuitry and physiological properties of pyramidal neurons in rat barrel cortex. Exp Brain Res. 1997;115:47–60. - PubMed
    1. Petersen CC, Grinvald A, Sakmann B. Spatiotemporal dynamics of sensory responses in layer 2/3 of rat barrel cortex measured in vivo by voltage-sensitive dye imaging combined with whole-cell voltage recordings and neuron reconstructions. J Neurosci. 2003;23:1298–1309. - PMC - PubMed
    1. Feldmeyer D, Lubke J, Sakmann B. Efficacy and connectivity of intracolumnar pairs of layer 2/3 pyramidal cells in the barrel cortex of juvenile rats. J Physiol (Lond) 2006;575:583–602. - PMC - PubMed
    1. Bosking WH, Zhang Y, Schofield B, Fitzpatrick D. Orientation selectivity and the arrangement of horizontal connections in tree shrew striate cortex. J Neurosci. 1997;17:2112–2127. - PMC - PubMed

Publication types

Substances