

Prolonged sleep restriction affects glucose metabolism in healthy young men
- PMID: 20414467
- PMCID: PMC2857625
- DOI: 10.1155/2010/108641
Prolonged sleep restriction affects glucose metabolism in healthy young men
Abstract
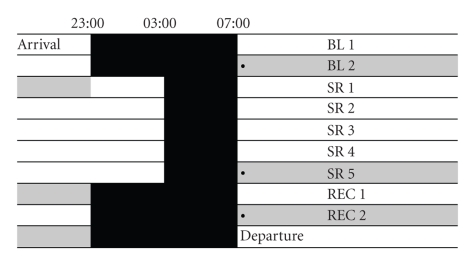
This study identifies the effects of sleep restriction and subsequent recovery sleep on glucose homeostasis, serum leptin levels, and feelings of subjective satiety. Twenty-three healthy young men were allocated to a control group (CON) or an experimental (EXP) group. After two nights of 8 h in bed (baseline, BL), EXP spent 4 h in bed for five days (sleep restriction, SR), followed by two nights of 8 h (recovery, REC). CON spent 8 h in bed throughout the study. Blood samples were taken after the BL, SR, and REC period. In EXP, insulin and insulin-to-glucose ratio increased after SR. IGF-1 levels increased after REC. Leptin levels were elevated after both SR and REC; subjective satiety remained unaffected. No changes were observed in CON. The observed increase of serum IGF-1 and insulin-to-glucose ratio indicates that sleep restriction may result in an increased risk to develop type 2 diabetes.
Figures

References
-
- Kronholm E, Partonen T, Laatikainen T, et al. Trends in self-reported sleep duration and insomnia-related symptoms in Finland from 1972 to 2005: a comparative review and re-analysis of Finnish population samples. Journal of Sleep Research. 2008;17(1):54–62. - PubMed
-
- Rajaratnam SMW, Arendt J. Health in a 24-h society. Lancet. 2001;358(9286):999–1005. - PubMed
-
- Schultes B, Schmid S, Peters A, Born J, Fehm HL. Sleep loss and the development of diabetes: a review of current evidence. Experimental and Clinical Endocrinology and Diabetes. 2005;113(10):563–567. - PubMed
-
- Spiegel K, Leproult R, Van Cauter E. Impact of sleep debt on metabolic and endocrine function. Lancet. 1999;354(9188):1435–1439. - PubMed
LinkOut - more resources
Full Text Sources
Medical
Research Materials
Miscellaneous
