

Review
doi: 10.1021/cr900325h.
Coordinating radiometals of copper, gallium, indium, yttrium, and zirconium for PET and SPECT imaging of disease
Affiliations
- PMID: 20415480
- PMCID: PMC2874951
- DOI: 10.1021/cr900325h
Item in Clipboard
Review
Coordinating radiometals of copper, gallium, indium, yttrium, and zirconium for PET and SPECT imaging of disease
Chem Rev.
.
No abstract available
Figures

Cartoon depicting the fundamental principle of Positron Emission Tomography (PET). As the targeting group interacts with the cell surface receptor, the positron emitting radio-metal decays by ejecting β+ particles from its nucleus. After traveling a short distance in the electron rich tissue, the positron recombines with an electron in a process called annihilation. During annihilation, the mass of the positron and electron are converted into two high energy photons (511 keV gamma rays), which are released approximately 180° apart to ensure that energy and momentum are conserved. Although attenuation is possible, these two gamma rays are usually energetic enough to escape the organism and be collected by the detectors of a PET scanner.

Selected acyclic chelators

Selected macrocyclic chelators

Cu-L6

Cu-GTS (L7)

Cu-PTSM (L8)

Cu-EDTA (L10)

Cu-DTPA (L12)

Cu-L17

Cu-L18

Cu-TACHPYR (L19)

Cu-NO2A (L28)

Cu-NOTA (L29)

Cu-NOTAM (L30)

Cu-L33

Cu-L35

Cu-DOTA (L39)

Cu-CB-DO2A (L37)

Cu-TE1A (L50)

Cu-L51

Cu-L52

Cu-H2TETA (L49)

Cu-L55

Cu-CB-TE2A (L57)

Cu-CB-TEAMA (L58)

Cu-TE2P (L54)

Cu-L62

Cu-L63

Cu-L64

Ga-L1

Ga-L2

Ga-BAT-TM (L4)

Ga-EC (L5)

Ga-EDTA (L10)

Ga-BAPEN (L16)

Ga-NOTA (L29)

Ga-TACN-TM (L27)

Ga-DOTA (L39)

Ga-DOTA-D-PheNH2 (L40)

Ga-DO3A-TPP (L44)
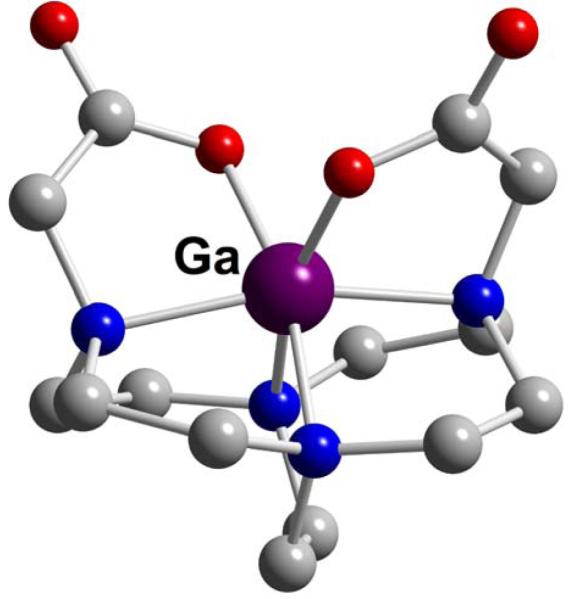
Ga-CB-DO2A (L37)
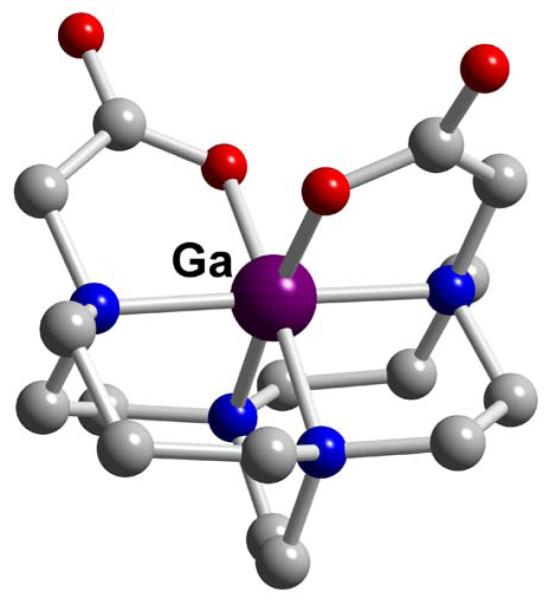
Ga-CB-TE2A (L57)

Ga-tris(benzohydroxamate)

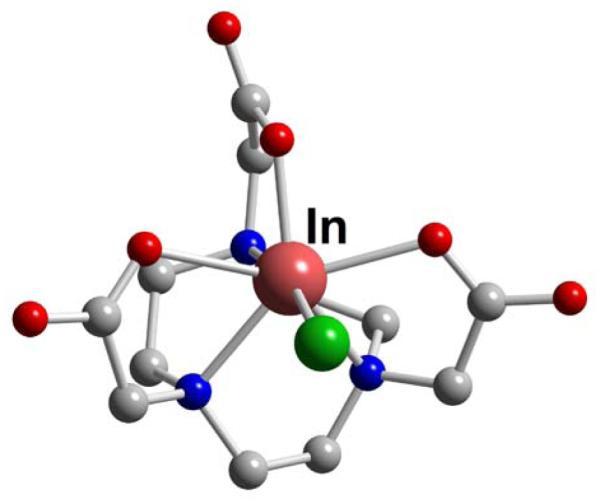
InCl-BAT-TM (L4)

In-L2•DMF

In-EC (L5)
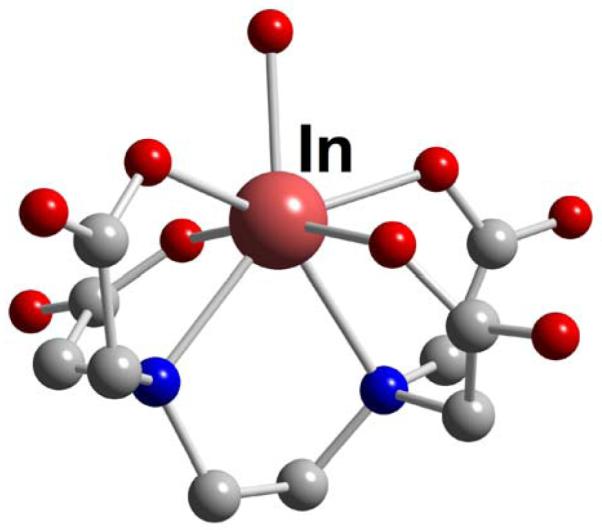
In-EDTA (L9)

In-DTPA (L12)
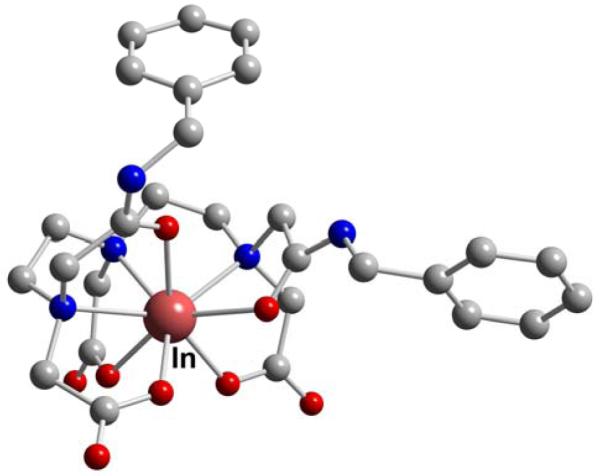
In-DTPA-BA2 (L13)
InCl-HNOTA (L29)

In-TACN (L26)-tris(2′-methylcarboxylmethyl)

In-TACN-TM (L27)
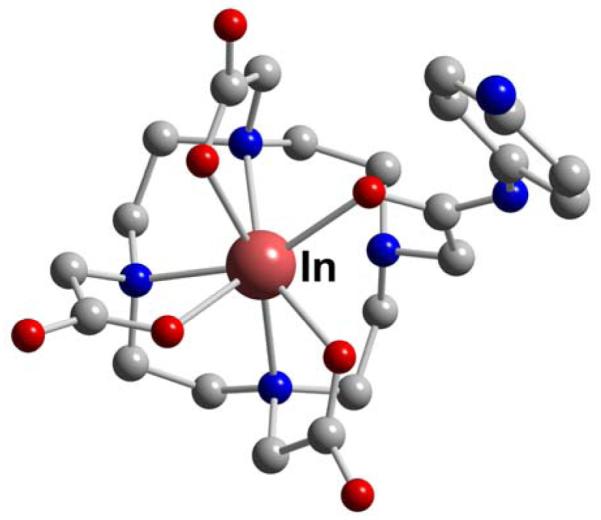
In-DOTA-AA (L41)

In-DOTA-TPP (L44)

In-TE3A (L53)

YF2-EDTA (L10)

Y-DTPA (L12)

Y-DTPA-BA2 (L13)

Y(triflate)2-NOTAM (L30)

[Y-DOTA]− (L39)
Y-DOTA-D-Phe-NH2 (L40)

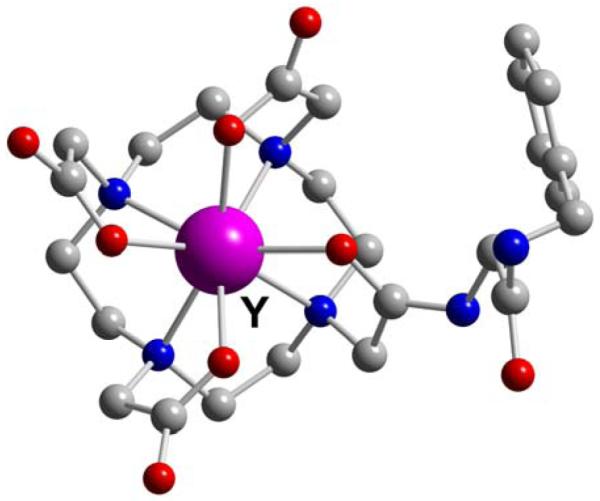
Y-DO3AP (L42)

Zr-EDTA (L10)

Zr-DTPA (L12)

Selected RGD analogues used in αvβ3 targeting radiopharmaceuticals.

Small-animal PET/CT of PTH-treated mice. Calvarium uptake of 64Cu-CB-TE2A-c(RGDyK) was higher in PTH-treated mice (7.4 MBq [199 mCi],115 ng, SUV 0.53) than in control mice (7.7 MBq [209 mCi], 121 ng, SUV 0.22) (50- to 60-min summed dynamic image). (A) In PTH-treated mice, uptake was reduced in all tissues, including calvarium, after injection of c(RGDyK) (PTH[left]: 159 mCi, 84 ng, SUV 5 0.33; block [right]: 164 mCi, 87 ng, SUV 5 0.18) (static image obtained 60 min after injection, 10-minscan). (B) Arrowheads indicate calvarium of each animal. Fiducials (*) are indicated. Reprinted with permission from reference . Copyright 2007 Society of Nuclear Medicine.

Selected somatostatin analogues used in somatostatin receptor targeting radiopharmaceuticals.

(A) Representative small animal PET image at 4 h of rat injected with 64Cu-CB-TE2A-sst2-ANT. Left image is representative slice from small-animal PET/CT fusion image and right image is small-animal PET projection view of same animal. Calculated SUV for the tumor in left hind limb was determined to be 2.7 and SUV for tumor in right hind limb was determined to be 2.8. (B) Representative small-animal PET image at 4 h of rat injected with 64Cu-CB-TE2Asst2-ANT and sst2-ANT as blocking agent. Left image is representative slice from small-animal PET/CT fusion image and right image is small-animal PET projection view of same animal. In animal receiving blockade, SUV for tumor in left hind limb was calculated to be 0.74 and SUV for tumor in right hind limb was calculated to be 0.51. (C) Graphical plot of change in average SUV over time. Even after 24 h, SUV remains high, suggesting enhanced binding of 64Cu-CB-TE2A-sst2-ANT for SST2 receptor. (D) Graphical representation that demonstrates change in observed SUV when excess cold sst2-ANT is coinjected with radiopharmaceutical, indicating that binding of radiopharmaceutical to SSTR-positive tumor is receptor-mediated. Reprinted with permission from reference . Copyright 2008 Society of Nuclear Medicine.

Selected bombesin analogues used in targeting the GRP receptor.

Coronal CT image (A) with clear subcutaneous localization of SKOV-3 tumor (arrow). Fusion of microPET and CT images (B) (168 h after injection) enables adequate quantitative measurement of 89Zr-bevacizumab in the tumor. Reprinted with permission from reference . Copyright 2007 Society of Nuclear Medicine.
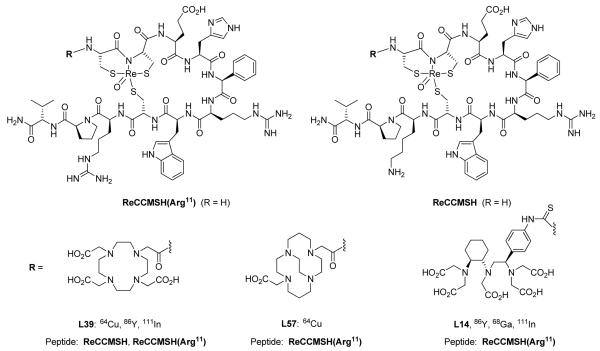
Selected α-MSH analogues that target the melanocortin-1 (MC-1) receptor.

Whole-body SPECT/CT, PET/CT and PET images of B16 melanoma tumor-bearing C57 mice 2 h post tail vein injection of radiolabeled CHX-A”-Re(Arg11)CCMSH. (A) SPECT/CT images of tumor-bearing mice injected intravenously with 12.95 MBq (350 μCi) of 111In-CHX-A”-Re(Arg11)CCMSH with (blocked) or without (nonblocked) a 20-μg nonradiolabeled peptide block. PET/CT and PET imaging of melanoma-bearing mice 2 h post tail vein injection of (B) 4.44 MBq (120 μCi) of 86Y-CHX-A”-Re(Arg11)CCMSH with a 20-μg NDP block (blocked) and without block (nonblocked) or (C) 3.7 MBq (100 μCi) of 68Ga-CHX-A”-Re(Arg11)CCMSH with (blocked) and without (nonblocked) a 60-μg NDP block, respectively. Tumor (T), kidney (K) and (BL) bladder locations are highlighted for each mouse. Reprinted with permission from reference . Copyright 2009 Elsevier Limited.

The synthetic antagonist DPC11870 targets the leukotriene B4 (LTB4) receptor.
References
-
- Society of Nuclear Medicine 2009. http://interactive.snm.org/index.cfm?PageID=5571&RPID=969.
-
- Welch MJ, Redvanly CS, editors. Handbook of Radiopharmaceuticals: Radiochemistry and Applications. John Wiley & Sons Inc.; Hoboken, NJ: 2003.
-
- Blower PJ, Lewis JS, Zweit J. Nucl. Med. Biol. 1996;23(8):957. - PubMed
-
- Wadas TJ, Wong EH, Weisman GR, Anderson CJ. Curr. Pharm. Des. 2007;13(1):3. - PubMed
-
- Smith SV. IDrugs. 2005;8(10):827. - PubMed
Publication types
MeSH terms
Substances
Grants and funding
LinkOut - more resources
Full Text Sources
Other Literature Sources
