

Late presentation for human immunodeficiency virus care in the United States and Canada
- PMID: 20415573
- PMCID: PMC2862849
- DOI: 10.1086/652650
Late presentation for human immunodeficiency virus care in the United States and Canada
Abstract
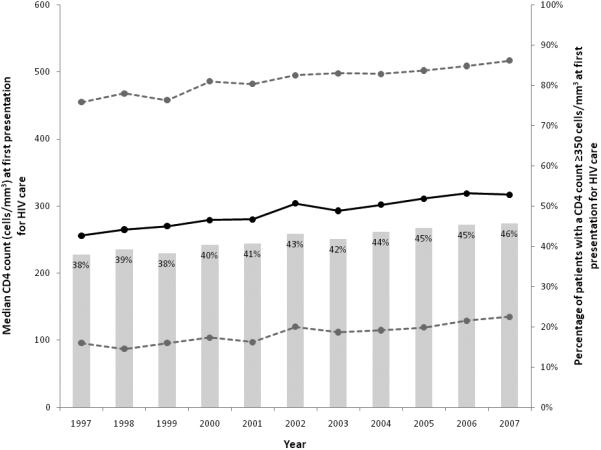
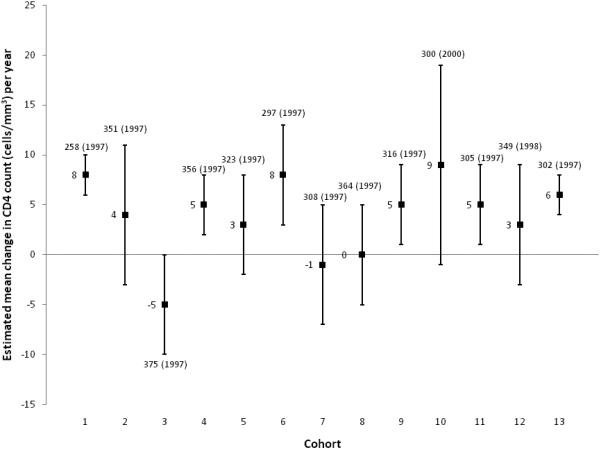
BACKGROUND. Initiatives to improve early detection and access to human immunodeficiency virus (HIV) services have increased over time. We assessed the immune status of patients at initial presentation for HIV care from 1997 to 2007 in 13 US and Canadian clinical cohorts. METHODS. We analyzed data from 44,491 HIV-infected patients enrolled in the North American-AIDS Cohort Collaboration on Research and Design. We identified first presentation for HIV care as the time of first CD4(+) T lymphocyte (CD4) count and excluded patients who prior to this date had HIV RNA measurements, evidence of antiretroviral exposure, or a history of AIDS-defining illness. Trends in mean CD4 count (measured as cells/mm(3)) and 95% confidence intervals were determined using linear regression adjusted for age, sex, race/ethnicity, HIV transmission risk, and cohort. RESULTS. Median age at first presentation for HIV care increased over time (range, 40-43 years; P < .01), whereas the percentage of patients with injection drug use HIV transmission risk decreased (from 26% to 14%; P < .01) and heterosexual transmission risk increased (from 16% to 23%; P < .01). Median CD4 count at presentation increased from 256 cells/mm(3) (interquartile range, 96-455 cells/mm(3)) to 317 cells/mm(3) (interquartile range, 135-517 cells/mm(3)) from 1997 to 2007 (P < .01). The percentage of patients with a CD4 count > or = 350 cells/mm(3) at first presentation also increased from 1997 to 2007 (from 38% to 46%; P < .01). The estimated adjusted mean CD4 count increased at a rate of 6 cells/mm(3) per year (95% confidence interval, 5-7 cells/mm(3) per year). CONCLUSION. CD4 count at first presentation for HIV care has increased annually over the past 11 years but has remained <350 cells/mm(3), which suggests the urgent need for earlier HIV diagnosis and treatment.
Figures
References
-
- Campsmith ML, Rhodes P, Hall HI, Green T. HIV Prevalence Estimates - United States, 2006. MMWR Weekly. 2008 Oct 3;57(39):1073–6. - PubMed
-
- Public Health Agency of Canada. HIV/AIDS Epi Updates, November 2007 Surveillance and Risk Assessment Division, Centre for Infectious Disease Prevention and Control, Public Health Agency of Canada. 2007
-
- Centers for Disease Control and Prevention Estimates of new HIV infections in the United States. CDC HIV/AIDS Fact Sheet. Aug 3, 2008. [cited 2009 Oct 12];Available from: URL: http://www.cdc.gov/hiv/topics/surveillance/incidence.htm.
-
- Centers for Disease Control and Prevention Persons Tested for HIV - United States. MMWR Weekly. 2008 Aug 8;57(31):845–9. - PubMed
MeSH terms
Grants and funding
- K01 AI071725/AI/NIAID NIH HHS/United States
- U01 AI031834/AI/NIAID NIH HHS/United States
- K24 DA000432/DA/NIDA NIH HHS/United States
- U01 AI038855/AI/NIAID NIH HHS/United States
- R01 DA004334/DA/NIDA NIH HHS/United States
- U01 AI034989/AI/NIAID NIH HHS/United States
- M01 RR000722/RR/NCRR NIH HHS/United States
- U01 AI069432/AI/NIAID NIH HHS/United States
- K01 AI071754/AI/NIAID NIH HHS/United States
- U01 AI034994/AI/NIAID NIH HHS/United States
- R21 AA015032/AA/NIAAA NIH HHS/United States
- U01 AI069918/AI/NIAID NIH HHS/United States
- N02 CP055504/CP/NCI NIH HHS/United States
- R01 DA012568/DA/NIDA NIH HHS/United States
- U01 AI035040/AI/NIAID NIH HHS/United States
- U01 AI034993/AI/NIAID NIH HHS/United States
- M01 RR000083/RR/NCRR NIH HHS/United States
- U01 AI035039/AI/NIAID NIH HHS/United States
- R01 AA016893/AA/NIAAA NIH HHS/United States
- P30 AI027767/AI/NIAID NIH HHS/United States
- U01 AI035042/AI/NIAID NIH HHS/United States
- U01 AI069434/AI/NIAID NIH HHS/United States
- M01 RR000079/RR/NCRR NIH HHS/United States
- U01 AI037984/AI/NIAID NIH HHS/United States
- R01 DA011602/DA/NIDA NIH HHS/United States
- R01 MH054907/MH/NIMH NIH HHS/United States
- Z01 CP010176/ImNIH/Intramural NIH HHS/United States
- U01 AI035004/AI/NIAID NIH HHS/United States
- UM1 AI069432/AI/NIAID NIH HHS/United States
- P30 AI054999/AI/NIAID NIH HHS/United States
- U01 AI037613/AI/NIAID NIH HHS/United States
- M01 RR000071/RR/NCRR NIH HHS/United States
- U01 AI035041/AI/NIAID NIH HHS/United States
- R24 AI067039/AI/NIAID NIH HHS/United States
- U01 AI038858/AI/NIAID NIH HHS/United States
- U10 AA013566/AA/NIAAA NIH HHS/United States
- U01 AI068636/AI/NIAID NIH HHS/United States
- U01 AI035043/AI/NIAID NIH HHS/United States
- P30 AI027757/AI/NIAID NIH HHS/United States
- U01 AI068634/AI/NIAID NIH HHS/United States
- P30 AI050410/AI/NIAID NIH HHS/United States
- U01 HD032632/HD/NICHD NIH HHS/United States
- U01 AI042590/AI/NIAID NIH HHS/United States
LinkOut - more resources
Full Text Sources
Medical
Research Materials
Miscellaneous
