. 2010 Jun 15;498(2):89-94.
doi: 10.1016/j.abb.2010.04.011. Epub 2010 Apr 20.

Regulation of Metnase's TIR binding activity by its binding partner, Pso4

Affiliations

Regulation of Metnase's TIR binding activity by its binding partner, Pso4

Brian D Beck et al. Arch Biochem Biophys. .

Abstract

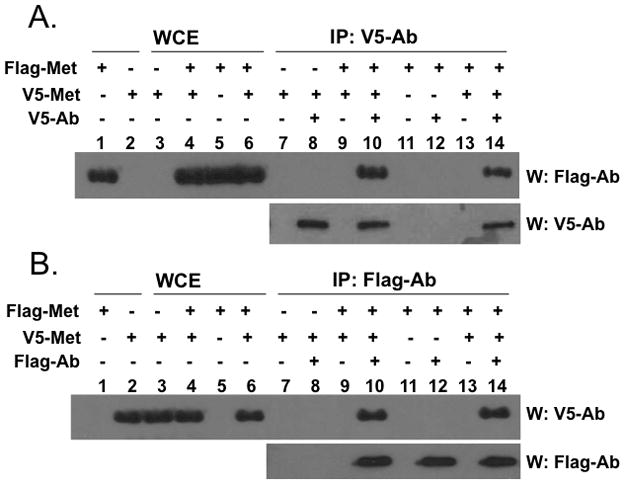
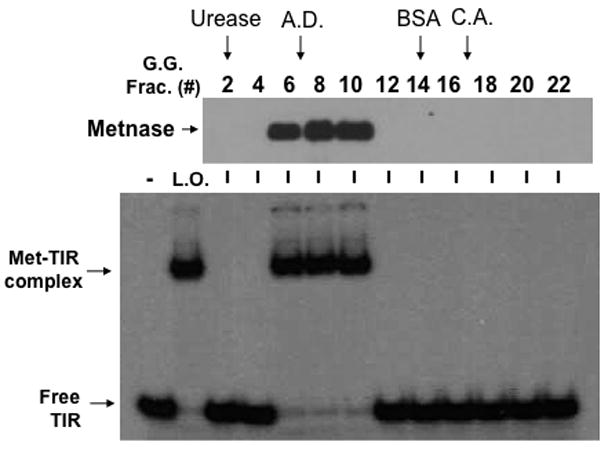
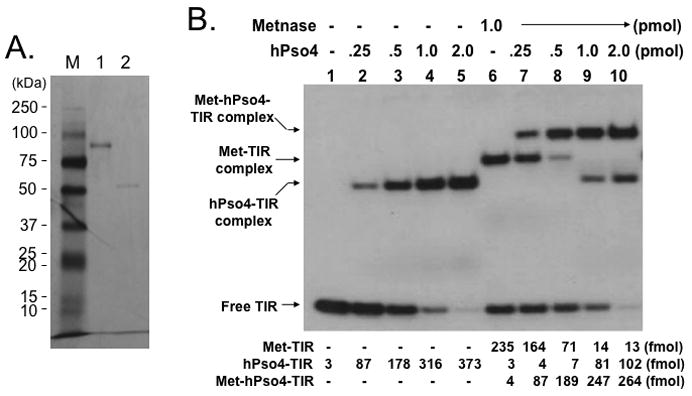
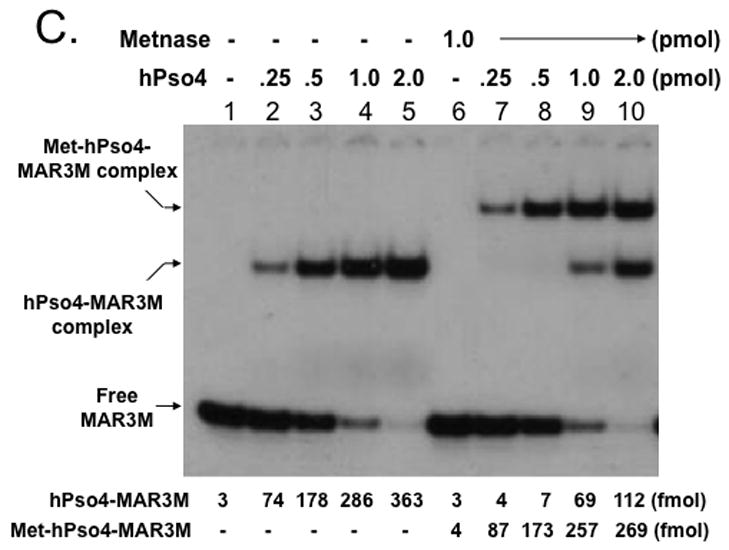
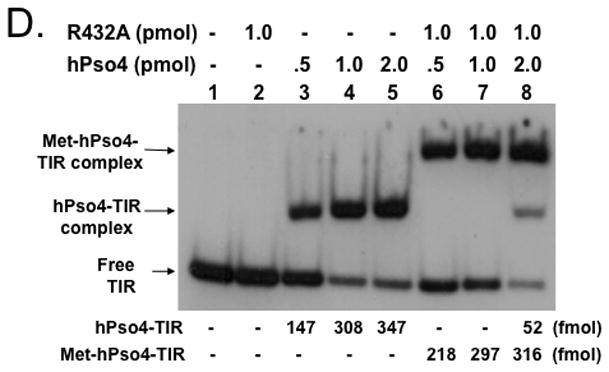
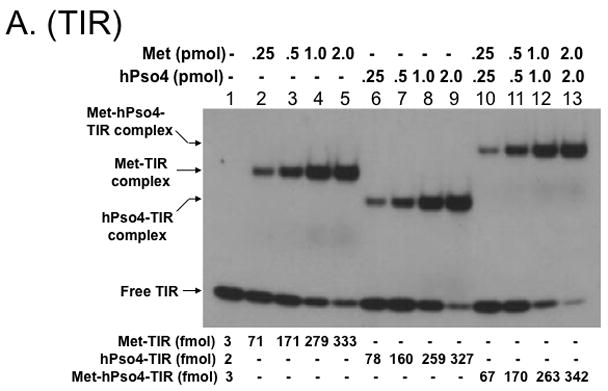
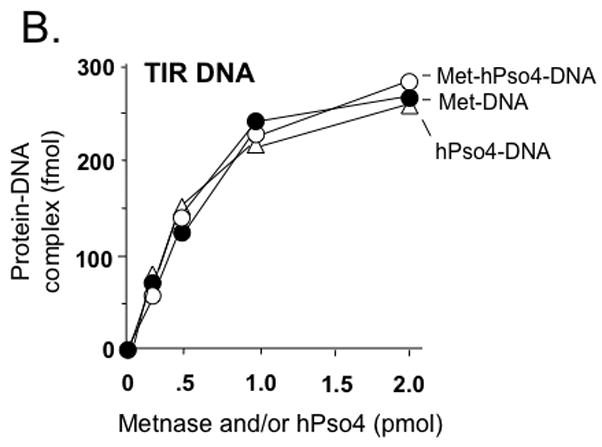
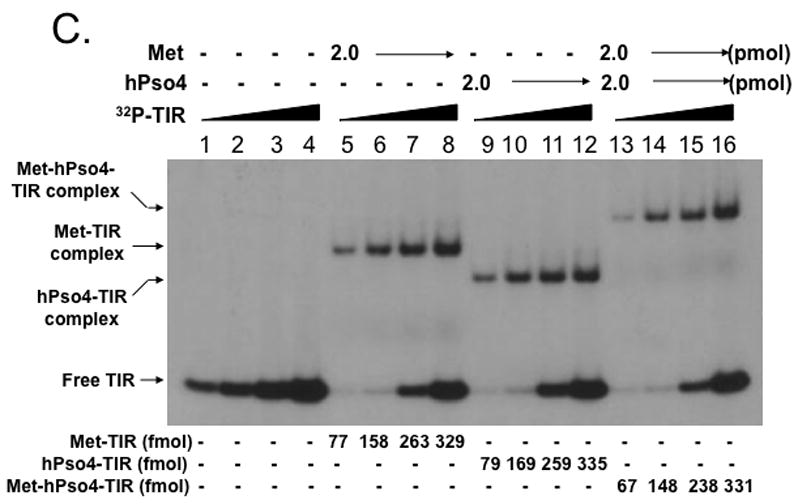
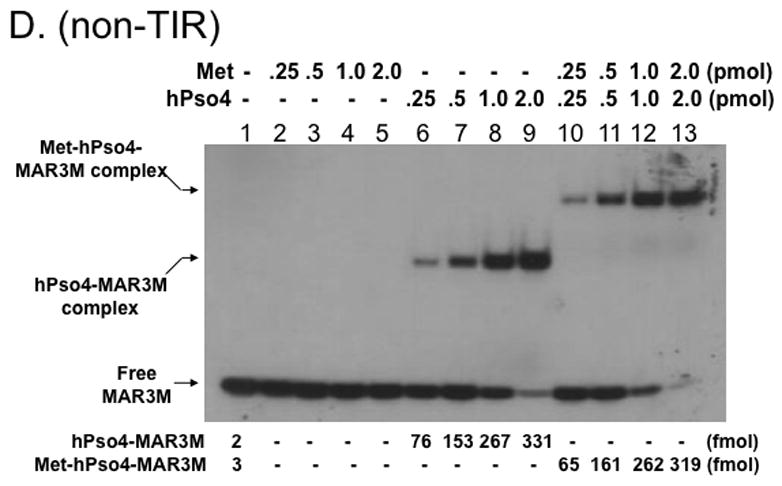
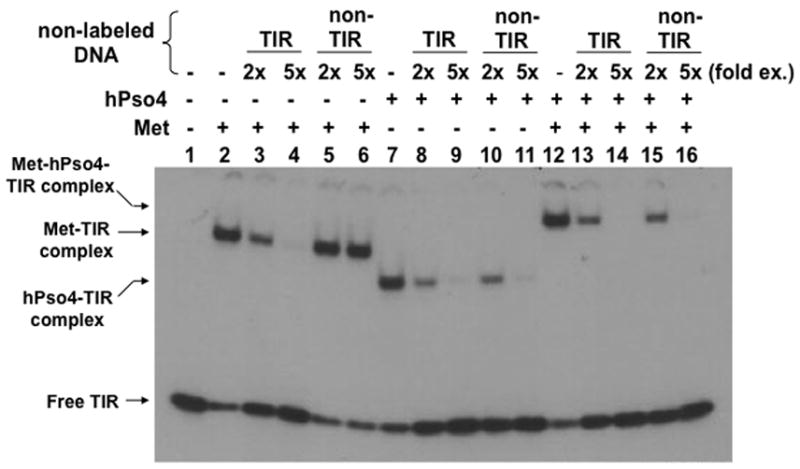
Metnase (also known as SETMAR) is a SET and transposase fusion protein in humans and plays a positive role in double-strand break (DSB) repair. While the SET domain possesses histone lysine methyltransferase activity, the transposase domain is responsible for 5'-terminal inverted repeat (TIR)-specific binding, DNA looping, and DNA cleavage activities. We recently demonstrated that human homolog of Pso4 (hPso4) is a Metnase binding partner that mediates Metnase binding to non-TIR DNA such as DNA damage sites. Here we show that Metnase functions as a dimer in its TIR binding. While both Metnase and hPso4 can independently interact with TIR DNA, Metnase's DNA binding activity is not required for formation of the Metnase-hPso4-DNA complex. A further stoichiometric analysis indicated that only one protein is involved in interaction with dsDNA when Metnase-hPso4 forms a stable complex. Interaction of the Metnase-hPso4 complex with TIR DNA was competitively inhibited by both TIR and non-TIR DNA, suggesting that hPso4 is solely responsible for binding to DNA in the Metnase-hPso4-DNA complex. Together, our study suggests that hPso4, once it forms a complex with Metnase, negatively regulates Metnase's TIR binding activity, which is perhaps necessary for Metnase localization at non-TIR sites such as DSBs.


Figures

Figure 1
Figure 1. Interaction of Metnase molecules in vivo
HEK-293 cells stably expressing V5-Metnase or Flag-Metnase were transfected with a vector harboring Flag-Metnase or V5-Metnase, respectively. Forty-eight hrs later, cell extracts were prepared and incubated with either an anti-V5 (panel A) or -Flag (panel B) monoclonal antibody for co-immunoprecipitation of V5- and Flag-Metnase. Following immunoprecipitation, samples were run on 10% SDS-PAGE and immunoblotted using either anti-Flag or -V5 antibody as indicated on the figure. In lanes 1–6, either purified Flag- or V5-Metnase (lanes 1 & 2) or whole cell extracts (WCE, lanes 3–6) were included as loading controls.
Figure 2
Figure 2. Metnase functions as a dimer in its binding to TIR DNA
Glycerol gradient sedimentation of wt-Metnase. An aliquot of the immunoaffinity-purified wt-Metnase was diluted with an equal volume of buffer B (50 mM Tris-HCl, pH 7.5, 5 mM DTT, 200 mM NaCl, 0.02 % (w/v) NP40, and 0.5 mM EDTA, pH 8.0) containing protein markers [urease (260 kDa, 11.8S), alcohol dehydrogenase (A.D.; 150 kDa, 7.4S), bovine serum albumin (BSA; 67 kDa, 4.4S), and carbonic anhydrase (C.A.; 29 kDa, 2.8S)] and layered onto a 4.2-ml linear 10–35% (vol/vol) glycerol gradient. Gradients were centrifuged at 45,500 rpm for 26 hr in a Beckman SW55 rotor at 4°C. Fractions were collected from the bottom and analyzed for wt-Metnase (western blot, top panel) and TIR-specific DNA binding activity (bottom panel). Arrows marked indicate positions of protein markers.
Figure 3
Figure 3. Formation of a stable Metnase-hPso4-DNA complex does not require Metnase’s DNA binding activity
A. SDS-PAGE of immunoaffinity purified Flag-Metnase (lane 1) and Flag-hPso4 (lane 2) used in this study. Lane M represents protein markers. B & C. Formation of a stable Metnase-hPso4 complex with TIR and non-TIR DNA. Reaction mixtures (20 ul) containing fixed amount of Metnase (0 or 1.0 pmol) were incubated with varying amounts of hPso4 (0.25, 0.5, 1.0, and 2.0 pmol) for 15 min prior to addition of 400 fmol of 5′-32P-labeled TIR DNA (panel B) or non-TIR DNA (MAR3M, panel C). Following 15 min incubation at 25°C, the protein-DNA complexes were analyzed by 5% native PAGE in the presence of 1X TBE. For quantification, individual bands were excised from dried gel and measured for radioactivity. D. A Metnase mutant (R432A) lacking DNA binding activity form a stable complex with hPso4 and dsDNA is independent of Metnase’s DNA binding activity. Reaction mixtures (20 ul) containing indicated amounts of R432A lacking TIR-specific DNA binding activity and/or hPso4 were mixed with 200 fmol of 5′-32P-labeled TIR and incubated for 15 min at 25°C, and analyzed by 5% native PAGE.
Figure 4
Figure 4. Metnase forms a 1:1 stoichiometric complex with hPso4 on dsDNA
A. Stoichiometric analysis of Metnase and/or hPso4 interaction with TIR DNA. Reaction mixtures (20 ul) containing indicated amounts of Metnase and/or hPso4 were incubated with 5′-32P-labeled DNA (400 fmol) for 15 min prior to 5% native PAGE analysis in the presence of 1X TBE. For quantification, individual bands were excised from dried gel and measured for radioactivity. B. Amounts of the Metnase-TIR (closed circle), hPso4-TIR (open triangle), and Metnase-hPso4-TIR complexes (open circle) from Fig. 4A were plotted. C. Relative TIR-binding activity of Metnase, hPso4, and the Metnase-hPso4 complex. Metnase, hPso4, or the Metnase-hPso4 complex (2 pmol each) was incubated with varying amounts (0.1, 0.2, 0.4, and 0.8 pmol) of 32P-TIR DNA at 25°C for 15 min prior to 5% native PAGE analysis. Individual protein-DNA complexes (marked on the left side of the figure) were quantified using the NIH image program (version 1.62). D. Stoichiometric analysis of Metnase and/or hPso4 interaction with non-TIR DNA (MAR3M). Reaction mixtures (20 ul) were the same as those described in Figure 4A, except for the use of 5′-32P-labeled non-TIR DNA (MAR3M, 400 fmol). Individual protein-DNA complexes were marked on the left side.
Figure 5
Figure 5. Interaction of the Metnase-hPso4 complex with TIR DNA is equally inhibited by both TIR and non-TIR DNA
Two pmol of Metnase, hPso4, or the Metnase-hPso4 complex was preincubated for 15 min at 25°C before addition of 200 fmol of 32P-TIR DNA and competitor DNA [400 fmol (2-fold excess) or 1,000 (5-fold excess) of unlabeled TIR or non-TIR (MAR3M) DNA]. Following 15 min incubation, the reaction mixtures were analyzed by 5% native PAGE. Individual protein-DNA complexes were marked on the left side.

Similar articles

Cited by

References

    1. Cordaux R, Udit S, Batzer MA, Feschotte C. Proc Natl Acad Sci U S A. 2006;103:8101–8106. - PMC - PubMed
    1. Lee SH, Oshige M, Durant ST, Rasila KK, Williamson EA, Ramsey H, Kwan L, Nickoloff JA, Hromas R. Proc Natl Acad Sci U S A. 2005;102:18075–18080. - PMC - PubMed
    1. Liu D, Bischerour J, Siddique A, Buisine N, Bigot Y, Chalmers R. Mol Cell Biol. 2007;27:1125–1132. - PMC - PubMed
    1. Roman Y, Oshige M, Lee YJ, Goodwin K, Georgiadis MM, Hromas RA, Lee SH. Biochemistry. 2007;46:11369–11376. - PMC - PubMed
    1. Beck BD, Park SJ, Lee YJ, Roman Y, Hromas RA, Lee SH. J Biol Chem. 2008;283:9023–9030. - PMC - PubMed

Publication types

MeSH terms

LinkOut - more resources