. 2010 Jun;16(6):1096-107.
doi: 10.1261/rna.2017210. Epub 2010 Apr 23.

Predicting in vivo binding sites of RNA-binding proteins using mRNA secondary structure

Affiliations

Predicting in vivo binding sites of RNA-binding proteins using mRNA secondary structure

Xiao Li et al. RNA. 2010 Jun.

Abstract

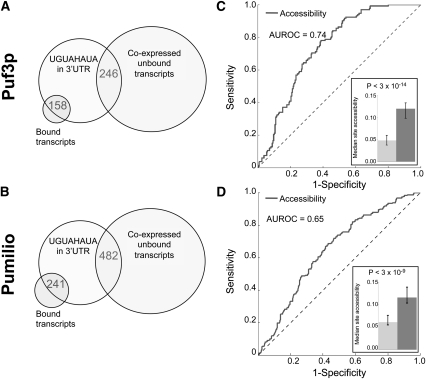
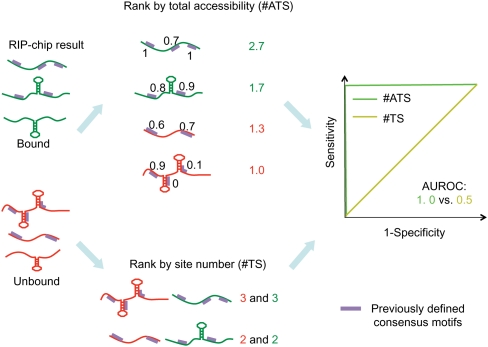
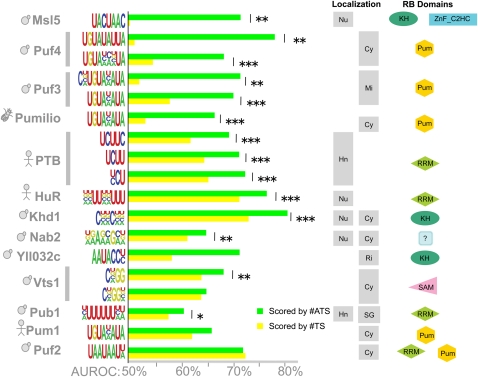
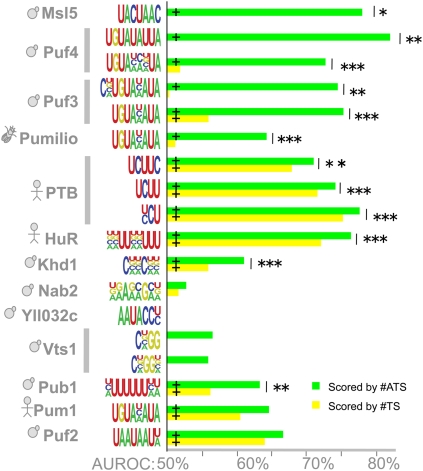
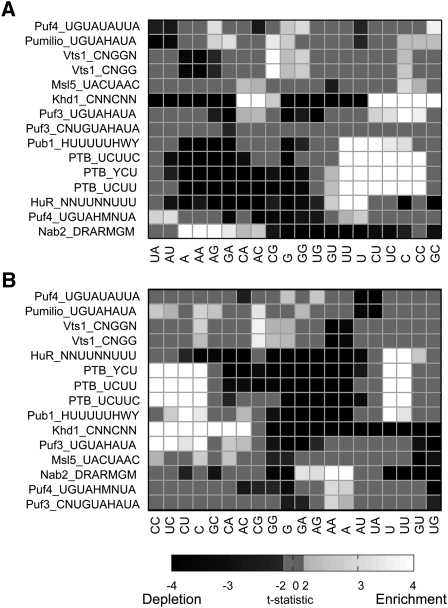
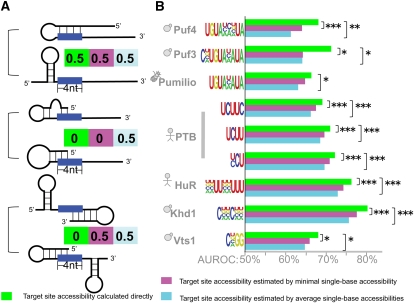
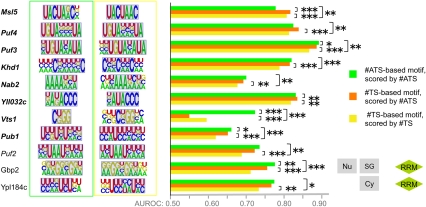
While many RNA-binding proteins (RBPs) bind RNA in a sequence-specific manner, their sequence preferences alone do not distinguish known target RNAs from other potential targets that are coexpressed and contain the same sequence motifs. Recently, the mRNA targets of dozens of RNA-binding proteins have been identified, facilitating a systematic study of the features of target transcripts. Using these data, we demonstrate that calculating the predicted structural accessibility of a putative RBP binding site allows one to significantly improve the accuracy of predicting in vivo binding for the majority of sequence-specific RBPs. In our new in silico approach, accessibility is predicted based solely on the mRNA sequence without consideration of the locations of bound trans-factors; as such, our results suggest a greater than previously anticipated role for intrinsic mRNA secondary structure in determining RBP binding target preference. Target site accessibility aids in predicting target transcripts and the binding sites for RBPs with a range of RNA-binding domains and subcellular functions. Based on this work, we introduce a new motif-finding algorithm that identifies accessible sequence-specific RBP motifs from in vivo binding data.


Figures

FIGURE 1.
FIGURE 1.
Puf3p and Pumilio consensus binding sites have higher accessibility in the 3′ UTRs of their bound mRNA targets. (A,B) While the consensus matches were significantly enriched in the set of bound transcripts for yeast Puf3p and fly Pumilio, more unbound transcripts contained consensus matches than bound ones (158 vs. 246 for yeast Puf3p [A], 241 vs. 482 for fly Pumilio [B]). (C,D) Comparison of site accessibility of transcripts coimmunoprecipitating (co-IPing) with Puf3p (C) and Pumilio (D) and those coexpressed but not co-IPing. All compared transcripts have only a single copy of the Puf3p/Pumilio consensus UGUAHAUA (H matches A, C, or U) in their 3′ UTRs (132 bound and 235 unbound transcripts for Puf3p; 201 bound and 414 unbound transcripts for Pumilio). The ROC curve (solid line) plots the sensitivity (i.e., the proportion of bound transcripts recovered; vertical axis) against [1 – specificity] (i.e., the proportion of unbound transcripts recovered; horizontal axis) as the accessibility threshold is adjusted from the highest to the lowest. (Inset) Median site accessibility for the bound set (dark gray bar) and the unbound set (light gray bar). Error bars represent the 95% confidence interval of the median calculated using 5000 bootstrap samples. P-values were calculated using the Wilcoxon–Mann–Whitney Rank Sum test.
FIGURE 2.
FIGURE 2.
Schematic of the in silico assay for measuring the impact of target site accessibility on RBP binding. The flowchart displays the procedure for evaluating accuracy at distinguishing bound and unbound sets of mRNA using either #ATS- or #TS-based scoring of an RBP consensus sequence. For each RIP-chip data set, transcripts were sorted in decreasing order by their relative enrichment among mRNAs copurifying with the RBP. We defined those with relative enrichment larger than the “positive threshold” to be the “bound” set of transcripts and those with relative enrichment smaller than the “negative threshold” to be the “unbound” set of transcripts. In this way, it was guaranteed that the transcripts in the unbound set were coexpressed with the RBP. We then identified all consensus-sequence matches (which we call “target sites”) in each transcript and removed transcripts with no target sites. We then ranked transcripts in decreasing order of number of target sites and used this ranking to calculate the #TS AUROC. To calculate #ATS, we first calculated the accessibility of each target site. This calculation considered all possible secondary structures, weighted according to their stability, so even sites that were single-stranded or paired in the most probable secondary structure (as displayed) could have a value <1 or >0, respectively. We ranked transcripts in decreasing order by the sum of the accessibilities of their target sites (i.e., #ATS) and calculated the associated AUROC.
FIGURE 3.
FIGURE 3.
Target site accessibility predicts in vivo binding for a diverse range of RBPs. Bar graphs compare the accuracy of #ATS and #TS at predicting bound transcripts based on a given consensus. To the left of the bar graph, each row is labeled by the RBP, the associated consensus sequence used for classification, and a cartoon indicating the species of origin (yeast, fly, or human). Some RBPs have multiple reported consensus sequences; these are grouped and indicated by a vertical bar. To the right of the bar graph, for each RBP, we show its known subcellular localization and its known RNA-binding domains (using SMART domains). (Left localization column) Nuclear localization (if any) as indicated: (Hn) hnRNP, (Nu) nucleus; (right localization column) cytoplasmic localization as indicated: (Cy) cytoplasm, (Mi) mitochondrion, (Ri) ribosome, (SG) stress granule. Supplemental File 1 contains the evidence for the reported localization and domains. The statistical significance of differences between #ATS AUROC (green bars) and #TS AUROC (yellow bars) was calculated using the Delong–Delong–Clarke–Pearson procedure: (*) P < 0.05, (**) P < 0.01, (***) P < 10−4. Exact P-values are in Supplemental File 2.
FIGURE 4.
FIGURE 4.
3′ UTR target site accessibility predicts in vivo binding. Results are presented as in Figure 3, but only target sites within the 3′ UTRs of transcripts were used to calculate #TS and #ATS. (+) AUROC is significantly different from random (Wilcoxon–Mann–Whitney, P < 0.05). Exact P-values are in Supplemental File 2.
FIGURE 5.
FIGURE 5.
Differences in dinucleotide composition around putative RBP binding sites between bound and unbound transcripts. (A) Heat map showing the t-statistic of the difference in di- and single-nucleotide frequencies in 40 bases upstream and downstream of the target site. (Rows) The RBP and its consensus binding sequence motifs (in IUPAC representation) used to identify target sites. (Columns) Single nucleotide versus dinucleotide. Rows and columns were ordered based on two-dimensional hierarchical clustering. Those t-statistics with absolute value <2 are not statistically significant at α = 0.05 and are set to 0; those with an absolute value >4 remain statistically significant after a Bonferroni correction and are thresholded at 4 or −4, as appropriate. (B) As for A, but using 20 bases up- and downstream.
FIGURE 6.
FIGURE 6.
Target site accessibility is a better predictor than average/minimal accessibility of single bases in the target site. (A) Diagrams represent examples of how secondary structure leads to differences in the calculated target site accessibility when the calculation is for the entire site (green), minimal single-base accessibility (magenta), or average single-base accessibility (light blue). In each case, two equally stable structures are shown, and the numbers represent accessibility calculated for a four-base site assuming each secondary structure is equally probable. (B) As per Figure 3 except that light blue and magenta bars show AUROCs for #ATS scoring when the target site accessibility is replaced with the average and minimal accessibility of all single bases in the target site. Exact P-values are in Supplemental File 2.
FIGURE 7.
FIGURE 7.
RBP motifs optimized to distinguish bound versus unbound transcripts. Each RBP is shown associated with two motifs: the #ATS-derived motif with the highest AUROC (green box) and the #TS-derived motif with the highest AUROC (yellow box) after motif finding was performed on the complete set of bound and unbound transcripts. (Gray background) Overlap of manually aligned regions of the #ATS and #TS motifs for the same RBP. The bar graphs display median AUROC over 30 held-out test sets for motifs trained to maximize #ATS AUROC and scored with #ATS (green bar), trained to maximize #TS AUROC and scored with #TS (yellow bar), and trained to maximize #TS AUROC but scored with #ATS (orange bar). We assessed P-values for differences in distributions of 30 AUROCs on matched test sets using the Wilcoxon sign-rank test. (Italicized RBP names) The RBP has a previously defined consensus sequence, (bold italics) a significant increase in #ATS reported in Figure 3. The P-value threshold is indicated as for Figure 3, and exact P-values are available in Supplemental File 2. Subcellular location and RBD domains are displayed for RBPs not represented in Figure 3.

References

    1. Akerman M, David-Eden H, Pinter RY, Mandel-Gutfreund Y 2009. A computational approach for genome-wide mapping of splicing factor binding sites. Genome Biol 10: R30 doi: 10.1186/gb-2009-10-3-r30 - PMC - PubMed
    1. Allers J, Shamoo Y 2001. Structure-based analysis of protein-RNA interactions using the program ENTANGLE. J Mol Biol 311: 75–86 - PubMed
    1. Aviv T, Lin Z, Ben-Ari G, Smibert CA, Sicheri F 2006. Sequence-specific recognition of RNA hairpins by the SAM domain of Vts1p. Nat Struct Mol Biol 13: 168–176 - PubMed
    1. Berman HM, Westbrook J, Feng Z, Gilliland G, Bhat TN, Weissig H, Shindyalov IN, Bourne PE 2000. The Protein Data Bank. Nucleic Acids Res 28: 235–242 - PMC - PubMed
    1. Bernhart SH, Hofacker IL, Stadler PF 2006. Local RNA base pairing probabilities in large sequences. Bioinformatics 22: 614–615 - PubMed

Publication types

MeSH terms

LinkOut - more resources