

Low pore connectivity increases bacterial diversity in soil
- PMID: 20418420
- PMCID: PMC2893478
- DOI: 10.1128/AEM.03085-09
Low pore connectivity increases bacterial diversity in soil
Abstract
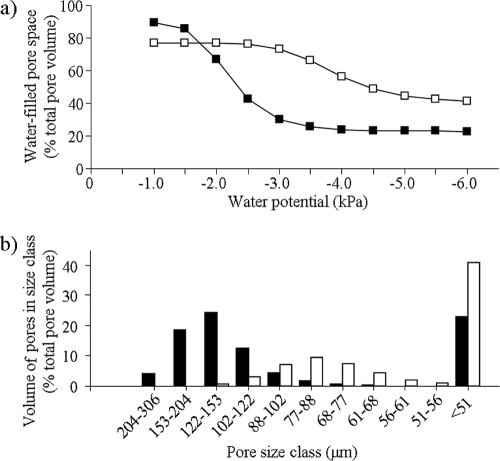
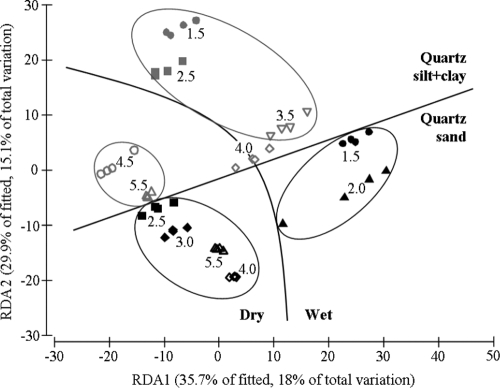
One of soil microbiology's most intriguing puzzles is how so many different bacterial species can coexist in small volumes of soil when competition theory predicts that less competitive species should decline and eventually disappear. We provide evidence supporting the theory that low pore connectivity caused by low water potential (and therefore low water content) increases the diversity of a complex bacterial community in soil. We altered the pore connectivity of a soil by decreasing water potential and increasing the content of silt- and clay-sized particles. Two textures were created, without altering the chemical properties or mineral composition of the soil, by adding silt- and clay-sized particles of quartz to a quartz-based sandy soil at rates of 0% (sand) or 10% (silt+clay). Both textures were incubated at several water potentials, and the effect on the active bacterial communities was measured using terminal restriction fragment length polymorphism (TRFLP) of bacterial 16S rRNA. Bacterial richness and diversity increased as water potential decreased and soil became drier (P < 0.012), but they were not affected by texture (P > 0.553). Bacterial diversity increased at water potentials of <or=2.5 kPa in sand and <or=4.0 kPa in silt+clay, equivalent to <or=56% water-filled pore space (WFPS) in both textures. The bacterial community structure in soil was affected by both water potential and texture (P < 0.001) and was correlated with WFPS (sum of squared correlations [delta(2)] = 0.88, P < 0.001). These findings suggest that low pore connectivity is commonly experienced by soil bacteria under field conditions and that the theory of pore connectivity may provide a fundamental principle to explain the high diversity of bacteria in soil.
Figures
References
-
- Anderson, M. J. 2001. A new method for non-parametric multivariate analysis of variance. Aust. Ecol. 26:32-46.
-
- Anderson, M. J. 2001. Permutation tests for univariate or multivariate analysis of variance and regression. Can. J. Fish. Aquat. Sci. 58:626-639.
-
- Anderson, M. J., and T. J. Willis. 2003. Canonical analysis of principal coordinates: a useful method of constrained ordination for ecology. Ecology 84:511.
-
- Bennett, L. T., S. Kasel, and J. Tibbits. 2008. Non-parametric multivariate comparisons of soil fungal composition: sensitivity to thresholds and indications of structural redundancy in T-RFLP data. Soil Biol. Biochem. 40:1601-1611.
Publication types
MeSH terms
Substances
LinkOut - more resources
Full Text Sources
Other Literature Sources
