. 2010 Jun;76(12):3886-97.
doi: 10.1128/AEM.02953-09. Epub 2010 Apr 23.

Diversity of 16S rRNA genes within individual prokaryotic genomes

Affiliations

Diversity of 16S rRNA genes within individual prokaryotic genomes

Anna Y Pei et al. Appl Environ Microbiol. 2010 Jun.

Erratum in

  • Appl Environ Microbiol. 2010 Aug;76(15):5333

Abstract

Analysis of intragenomic variation of 16S rRNA genes is a unique approach to examining the concept of ribosomal constraints on rRNA genes; the degree of variation is an important parameter to consider for estimation of the diversity of a complex microbiome in the recently initiated Human Microbiome Project (http://nihroadmap.nih.gov/hmp). The current GenBank database has a collection of 883 prokaryotic genomes representing 568 unique species, of which 425 species contained 2 to 15 copies of 16S rRNA genes per genome (2.22 +/- 0.81). Sequence diversity among the 16S rRNA genes in a genome was found in 235 species (from 0.06% to 20.38%; 0.55% +/- 1.46%). Compared with the 16S rRNA-based threshold for operational definition of species (1 to 1.3% diversity), the diversity was borderline (between 1% and 1.3%) in 10 species and >1.3% in 14 species. The diversified 16S rRNA genes in Haloarcula marismortui (diversity, 5.63%) and Thermoanaerobacter tengcongensis (6.70%) were highly conserved at the 2 degrees structure level, while the diversified gene in B. afzelii (20.38%) appears to be a pseudogene. The diversified genes in the remaining 21 species were also conserved, except for a truncated 16S rRNA gene in "Candidatus Protochlamydia amoebophila." Thus, this survey of intragenomic diversity of 16S rRNA genes provides strong evidence supporting the theory of ribosomal constraint. Taxonomic classification using the 16S rRNA-based operational threshold could misclassify a number of species into more than one species, leading to an overestimation of the diversity of a complex microbiome. This phenomenon is especially seen in 7 bacterial species associated with the human microbiome or diseases.


Figures

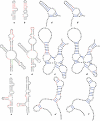
FIG. 1.
FIG. 1.
Secondary structures of 16S rRNA genes from Thermoanaerobacter tengcongensis. (a) The distribution of substitutions is shown on the secondary structure predicted for rrnB16S, based on free energy minimization (31) with the consensus 16S rRNA gene model as reference (53). Positions that differ between rrnB16S and rrnC16S are shown in colored letters. Conservative changes located in loops or compensatory changes due to covariation in stems are shown in blue; changes that result in alteration of secondary structures are shown in red. Insertions/deletions are shown in brown. Substitutions are coded as follows: K = G or U, M = A or C, R = A or G, S = C or G, W = A or U, and Y = C or U. (b) The distribution of substitutions also is shown on the variability map based on the 2° structure models for Thermus thermophilus (53). Mismatched positions between rrnB16S and rrnC16S are highlighted in colors according to the position-specific relative variability rate, calculated from the consensus rrn16S model based on an alignment of 3,407 bacterial 16S rRNA genes (53). A position with a relative substitution rate of v > 1 (red) implies that it has a substitution rate higher than the average substitution rate of all its sites in the rRNA gene analyzed, while v < 1 (blue) indicates that the rate is lower than the average rate. Uncommon sites are positions that are occupied in <25% of organisms because of insertions, which are shown by black dots. The expected variability was calculated from the consensus models (c).
FIG. 2.
FIG. 2.
Homologs of the 28- and 31-bp inserts in T. tengcongensis rrnC 16S rRNA genes also are present in 16S rRNA genes of T. kivui and T. siderophilus. The 24- and 28-bp inserts were separated by a 6-nucleotide conserved sequence shown in red.
FIG. 3.
FIG. 3.
Conservation of 2° structure by complex rearrangement of base pairing and substitutions in 16S rRNA genes of S. woodyi (a and a′ and b and b′), C. cellulolyticum (c and c′ and d and d′), and P. profundum (e and e′ and f and f′). Each molecule was folded using a program based on thermodynamics (a, b, c, d, e, and f), as well as a program based on multiple sequence alignment (a′, b′, c′, d′, e′, and f′), as described in Materials and Methods. For thermodynamic folding, the regions 50 bp upstream of the first mutation and 50 bp downstream of the last mutation were used to create the structures for each rRNA molecule, while only the area of interest is shown. Nucleotides related to substitutions are highlighted in red and indels in green. For folding using the multiple-sequence-alignment approach, nucleotides making up noncanonical base pairs are highlighted in brown (35, 36). Segments of rrn16S of S. woodyi correspond to positions 965 through 1065 of rrnC16S and rrnD16S. The segments of rrnC16S (a and a′) and rrnD16S (b and b′) differ by 13 positions, all substitutions. Segments of rrn16S of C. cellulolyticum correspond to positions 31 through 256 of rrnA16S and rrnE16S. The segments of rrnA16S (c and c′) and rrnE16S (d and d′) differ by 28 positions, including 10 indels and 18 substitutions. Segments of rrn16S of P. profundum correspond to positions 129 through 254 of rrnC16S and rrnE16S. The segments of rrnC16S (e and e′) and rrnE16S (f and f′) differ by 12 positions, including 1 indel and 11 substitutions.
FIG. 4.
FIG. 4.
Secondary structures of 16S rRNA genes from Borrelia afzelii. (a) The distribution of substitutions is shown on the secondary structure predicted for rrnB16S, based on free energy minimization (31) with the consensus 16S rRNA gene model as the reference (53). Positions that differ between rrnB16S and rrnA16S are shown in colored letters. Conservative changes located in loops or compensatory changes due to covariation in stems are shown in blue; changes that result in alteration of secondary structures are shown in red. Insertions/deletions are shown in brown. Substitutions are coded as follows: K = G or U, M = A or C, R = A or G, S = C or G, W = A or U, and Y = C or U. (b) The distribution of substitutions is also shown on the variability map based on the 2° structure models for Escherichia coli (53). Substitutions between rrnB16S and rrnA16S are highlighted in colors according to the position-specific relative variability rate calculated from the consensus rrn16S model based on an alignment of 3,407 bacterial 16S rRNA genes (53). A position with a relative substitution rate of v > 1.18 (red) implies that it has a substitution rate higher than the average substitution rate of all of its sites in the rRNA gene analyzed, while v < 1.18 (blue) indicates that the rate is lower than the average. Uncommon sites are positions that are occupied in <25% of organisms because of insertions, which are shown by black dots. The expected variability was calculated from the consensus models (c).

References

    1. Abdulkarim, F., and D. Hughes. 1996. Homologous recombination between the tuf genes of Salmonella typhimurium. J. Mol. Biol. 260:506-522. - PubMed
    1. Acinas, S. G., L. A. Marcelino, V. Klepac-Ceraj, and M. F. Polz. 2004. Divergence and redundancy of 16S rRNA sequences in genomes with multiple rrn operons. J. Bacteriol. 186:2629-2635. - PMC - PubMed
    1. Arbique, J. C., C. Poyart, P. Trieu-Cuot, G. Quesne, M. da Glória, S. Carvalho, A. G. Steigerwalt, R. E. Morey, D. Jackson, R. J. Davidson, and R. R. Facklam. 2004. Accuracy of phenotypic and genotypic testing for identification of Streptococcus pneumoniae and a description of Streptococcus pseudopneumoniae sp. nov. J. Clin. Microbiol. 42:4686-4696. - PMC - PubMed
    1. Bao, Q., Y. Tian, W. Li, Z. Xu, Z. Xuan, S. Hu, W. Dong, J. Yang, Y. Chen, Y. Xue, Y. Xu, X. Lai, L. Huang, X. Dong, Y. Ma, L. Ling, H. Tan, R. Chen, J. Wang, J. Yu, and H. Yang. 2002. A complete sequence of the T. tengcongensis genome. Genome Res. 12:689-700. - PMC - PubMed
    1. Bindewald, E., and B. A. Shapiro. 2006. RNA secondary structure prediction from sequence alignments using a network of k-nearest neighbor classifiers. RNA 12:342-352. - PMC - PubMed

Publication types

Substances

LinkOut - more resources