. 2010 May 6;465(7294):86-90.
doi: 10.1038/nature08959. Epub 2010 Apr 25.

Cis-interactions between Notch and Delta generate mutually exclusive signalling states

Affiliations

Cis-interactions between Notch and Delta generate mutually exclusive signalling states

David Sprinzak et al. Nature. .

Abstract

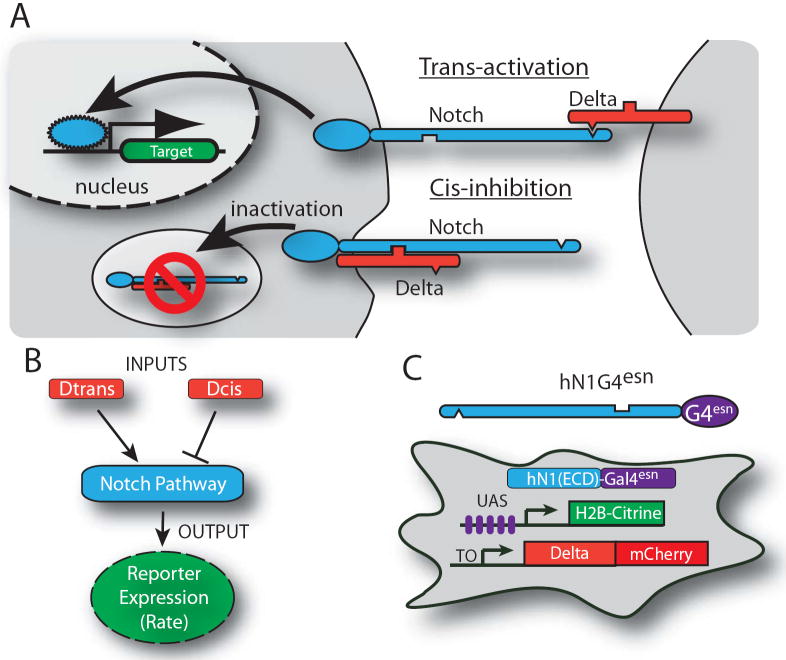
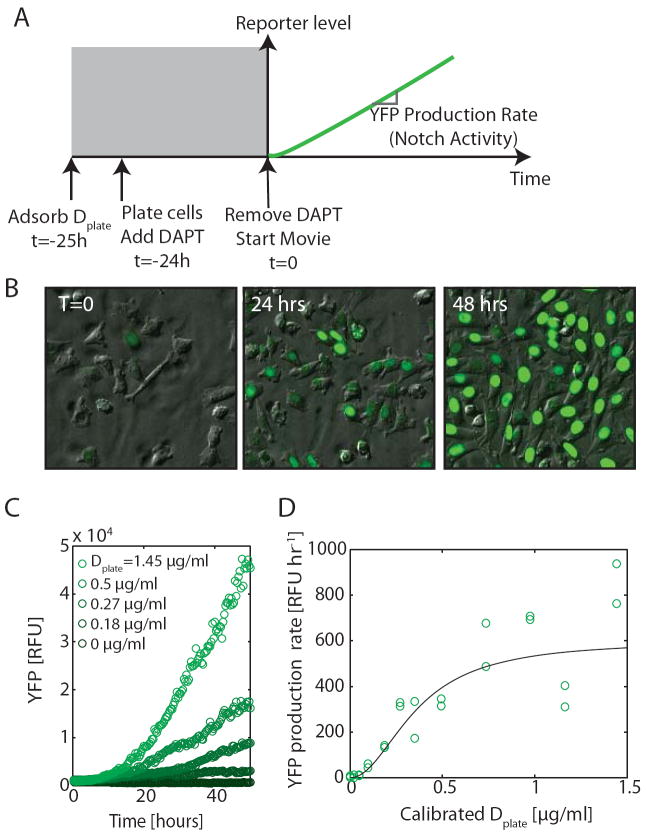
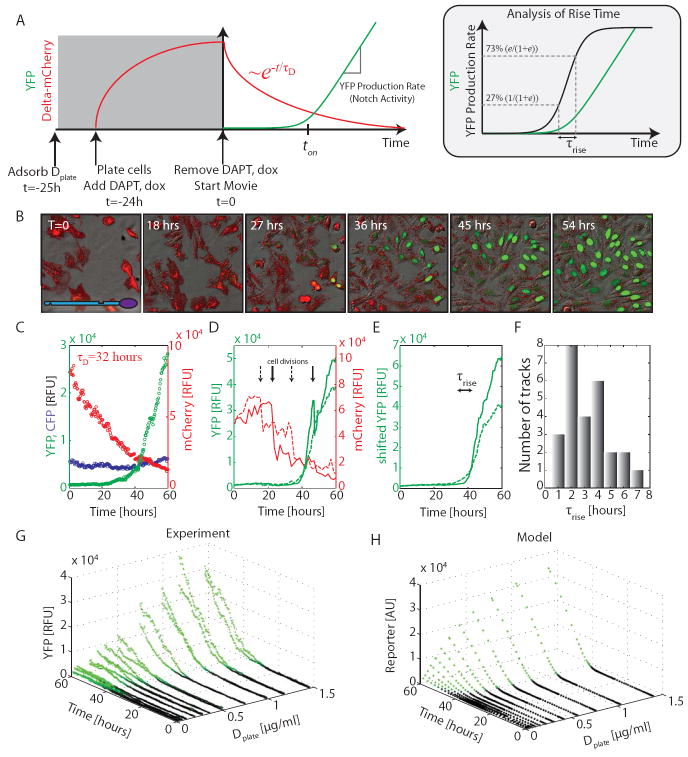
The Notch-Delta signalling pathway allows communication between neighbouring cells during development. It has a critical role in the formation of 'fine-grained' patterns, generating distinct cell fates among groups of initially equivalent neighbouring cells and sharply delineating neighbouring regions in developing tissues. The Delta ligand has been shown to have two activities: it transactivates Notch in neighbouring cells and cis-inhibits Notch in its own cell. However, it remains unclear how Notch integrates these two activities and how the resulting system facilitates pattern formation. Here we report the development of a quantitative time-lapse microscopy platform for analysing Notch-Delta signalling dynamics in individual mammalian cells, with the aim of addressing these issues. By controlling both cis- and trans-Delta concentrations, and monitoring the dynamics of a Notch reporter, we measured the combined cis-trans input-output relationship in the Notch-Delta system. The data revealed a striking difference between the responses of Notch to trans- and cis-Delta: whereas the response to trans-Delta is graded, the response to cis-Delta is sharp and occurs at a fixed threshold, independent of trans-Delta. We developed a simple mathematical model that shows how these behaviours emerge from the mutual inactivation of Notch and Delta proteins in the same cell. This interaction generates an ultrasensitive switch between mutually exclusive sending (high Delta/low Notch) and receiving (high Notch/low Delta) signalling states. At the multicellular level, this switch can amplify small differences between neighbouring cells even without transcription-mediated feedback. This Notch-Delta signalling switch facilitates the formation of sharp boundaries and lateral-inhibition patterns in models of development, and provides insight into previously unexplained mutant behaviours.


Figures

Figure 1
Figure 1. System for analyzing signal integration in the Notch-Delta pathway
(A) Notch (blue) and Delta (red) interactions are indicated schematically. (B) Notch activity integrates cis- and trans-Delta. (C) CHO-K1 cell line for analyzing Notch activity. (C) The hN1G4esn cell line stably incorporates a variant of hNotch1 in which the activator Gal4esn replaces Notch ICD. This cell line also contains genes for Histone 2B (H2B)-Citrine (YFP) reporter controlled by a UAS promoter, a Tet-inducible Delta-mCherry fusion protein, and a constitutively expressed H2B-Cerulean (CFP) for image segmentation (not shown). A similar cell line expressing full length hNotch1 (hN1 cell line) was also analyzed (Figs. S1, S2). These cells exhibit no detectable endogenous Notch or Delta activities. Notch-Delta interactions are indicated schematically and do not represent molecular interaction mechanisms.
Figure 2
Figure 2. Trans-activation of Notch occurs in a graded fashion
(A) Schematic of experimental design. The rate of increase of fluorescence (slope of green line) measures Notch activity. (B) Typical hN1G4esn filmstrip, with Dplate=1.16 μg/ml, and frame times as indicated (Movie S1, cf. Fig. S6). (C) hN1G4esn cells respond in a graded manner to varying Dplate concentrations. Curves show the median fluorescence of individual cells within a single field of view for selected Dplate levels (see Fig. S15 for distributions). (D) The relationship between Dplate and Notch activity (in Relative Fluorescence Units per hour, from the linear regime in (C)). Hill function fit is indicated by black lines, with Hill coefficient n=1.7 (95% confidence interval (CI): 0.8-2.7). Similar results were obtained using the hN1 cell line (Fig. S1). Note that doxycycline does not directly affect Notch activation or cell growth, nor does Dplate affect cell growth (Fig. S12).
Figure 3
Figure 3. Cis/trans signal integration by Notch
(A) Schematic of the experimental protocol. Inset: Rise time, τrise, is the time required for Notch activity (black line, or slope of green line) to change by a factor of e . (B) Filmstrip of hN1G4esn cells, with Dplate=1.45 μg/ml (Movie S2), showing Delta-mCherry fluorescence (red) and concomitant activation of Notch reporter (green); times as indicated (cf. Fig. S6). (C) Population average (median) response for the same movie shows a slow decay of Delta-mCherry fluorescence (red points), but a sharp response of reporter expression (green points). Constitutively expressed pCMV-H2B-Cerulean (blue) remains constant (control). Compare single-cell tracks in Fig. S13, and response to modulation of dox in Fig. S14. (D) Single-cell response for two individual cells (solid and dashed lines, colors as in C). Black arrows mark cell divisions. (E) Single cell traces in (D) replotted, but shifted up after each cell division event to ‘add back’ sister cell fluorescence, in order to show the continuity of Notch activity (see also Fig. S13). (F) Histogram of τrise from 26 non-overlapping cell lineages (Fig. S13). (G) Notch response to both cis and trans Delta. Data shown are from 2 duplicate movies acquired at each of 12 Dplate values for hN1G4esn cells. Green coloring indicates points that exceed a detection threshold. Note that turn-on (black to green transition) occurs at approximately the same time in all movies. (H) Simulations based on the model in Box 1 are qualitatively similar to data in (G) (see supplementary and Fig. S16 for model details).
Figure 4
Figure 4. The mutual inactivation model in multicellular patterning
(A) Signal amplification (schematic). Two interacting cells with the same amount of Notch (here, 2 molecules), but different amounts of Delta (1 or 3 molecules). Due to the cis-interaction between Notch and Delta, signaling is strongly biased to cell1. (B) Notch amplifies differences between cells. Signal amplification, defined as shown, for two interacting cells, with different Delta production rates, βD(2) = 1.35 βD(1) (see model in supplementary). The x-axis specifies the average Delta production rate, <βD>=12(βD(2)+βD(1)). Maximum amplification occurs when Delta production rates flank βN (vertical line). Stronger mutual inactivation (smaller kc/kt) increases signal amplification. (C-D) Sharp boundary formation in response to a gradient of Delta production. (C) Simulation of a field of interacting cells in which Delta production rates decay exponentially from the center, according to βD (x) = βD0exp (−x/x0) with x0 =7 cells (dashed red line). Notch production rate, βN, is constant (dashed blue line). Resulting free Notch and Delta protein levels are indicated (solid lines). Notch activation occurs in two sharply defined columns of cells (green line in plot and green cells in cellular diagram). (D) This model explains suppression of mutant phenotypes. Gray lines indicate positions where βN = βD (x), leading to Notch activity peaks. Simultaneous reduction of both Notch and Delta production rates by half maintains boundary positions (dotted lines) (Fig. S10). (F-G) Mutual inactivation facilitates lateral inhibition patterning, shown schematically in (F). (G) In the absence of cooperativity in regulatory feedback, a standard lateral inhibition model cannot pattern (first panel) while a model of lateral inhibition with mutual inactivation can (second panel).

References

    1. Artavanis-Tsakonas S, Rand MD, Lake RJ. Notch signaling: cell fate control and signal integration in development. Science. 1999;284:770–776. - PubMed
    1. Goodyear R, Richardson G. Pattern formation in the basilar papilla: evidence for cell rearrangement. J Neurosci. 1997;17:6289–6301. - PMC - PubMed
    1. Heitzler P, Simpson P. The choice of cell fate in the epidermis of Drosophila. Cell. 1991;64:1083–1092. doi:0092-8674(91)90263-X [pii] - PubMed
    1. Huppert SS, Jacobsen TL, Muskavitch MA. Feedback regulation is central to Delta-Notch signalling required for Drosophila wing vein morphogenesis. Development. 1997;124:3283–3291. - PubMed
    1. de Celis JF, Bray S, Garcia-Bellido A. Notch signalling regulates veinlet expression and establishes boundaries between veins and interveins in the Drosophila wing. Development. 1997;124:1919–1928. - PubMed

Publication types