. 2010 May;12(5):436-46.
doi: 10.1038/ncb2045. Epub 2010 Apr 25.

A novel EF-hand protein, CRACR2A, is a cytosolic Ca2+ sensor that stabilizes CRAC channels in T cells

Affiliations

A novel EF-hand protein, CRACR2A, is a cytosolic Ca2+ sensor that stabilizes CRAC channels in T cells

Sonal Srikanth et al. Nat Cell Biol. 2010 May.

Abstract

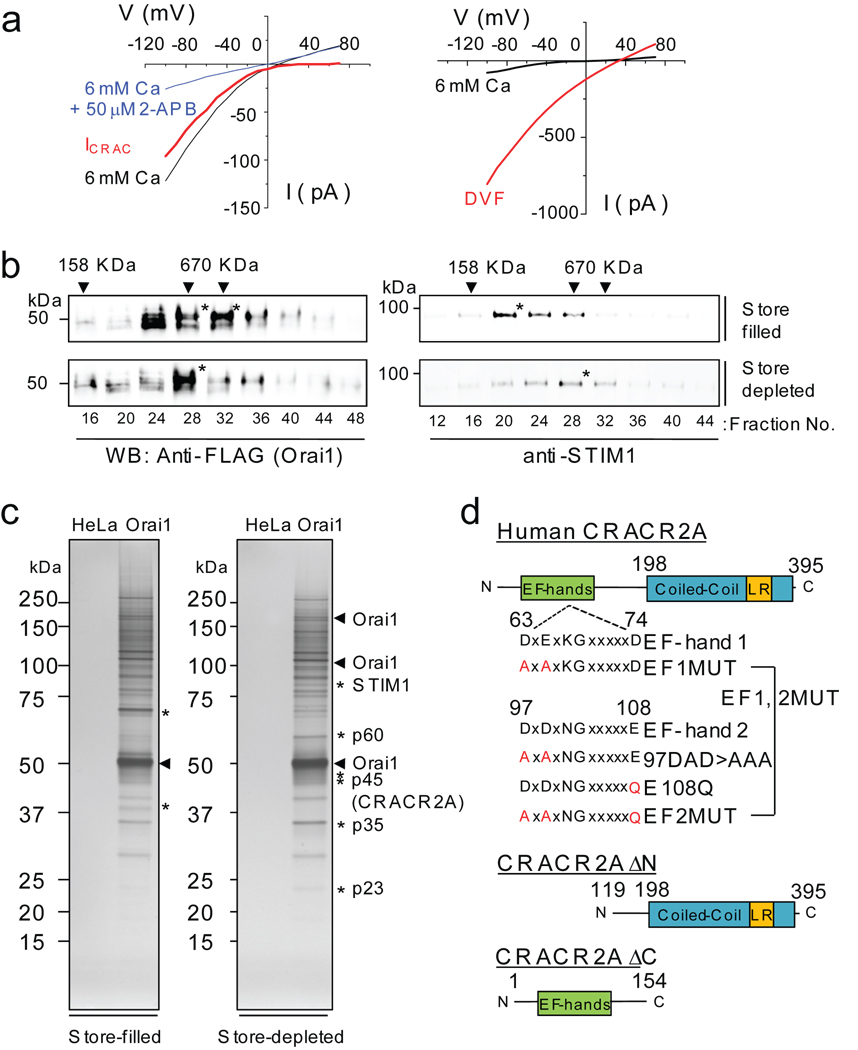
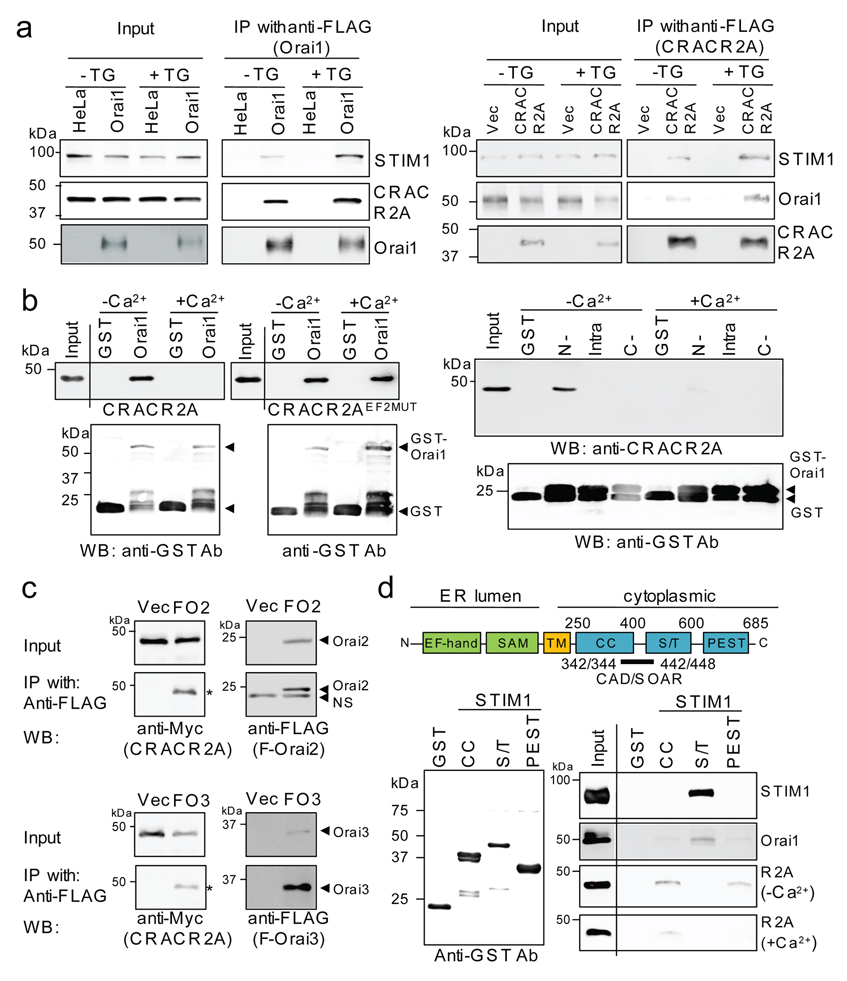
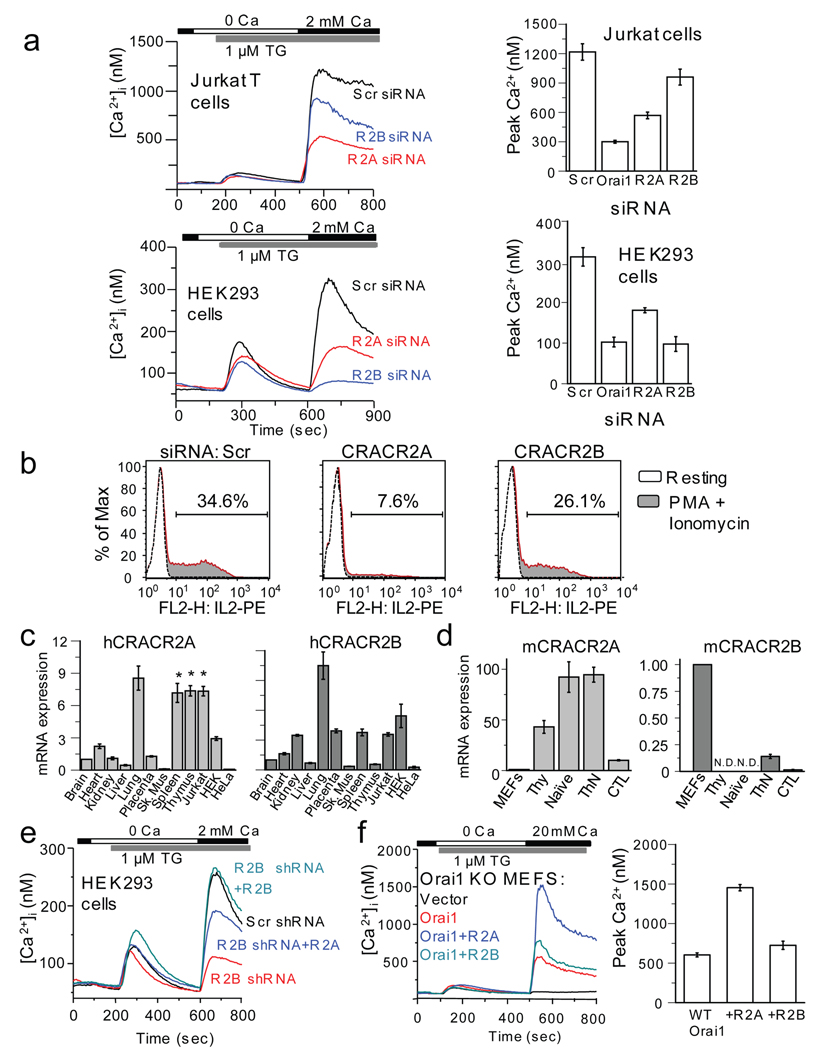
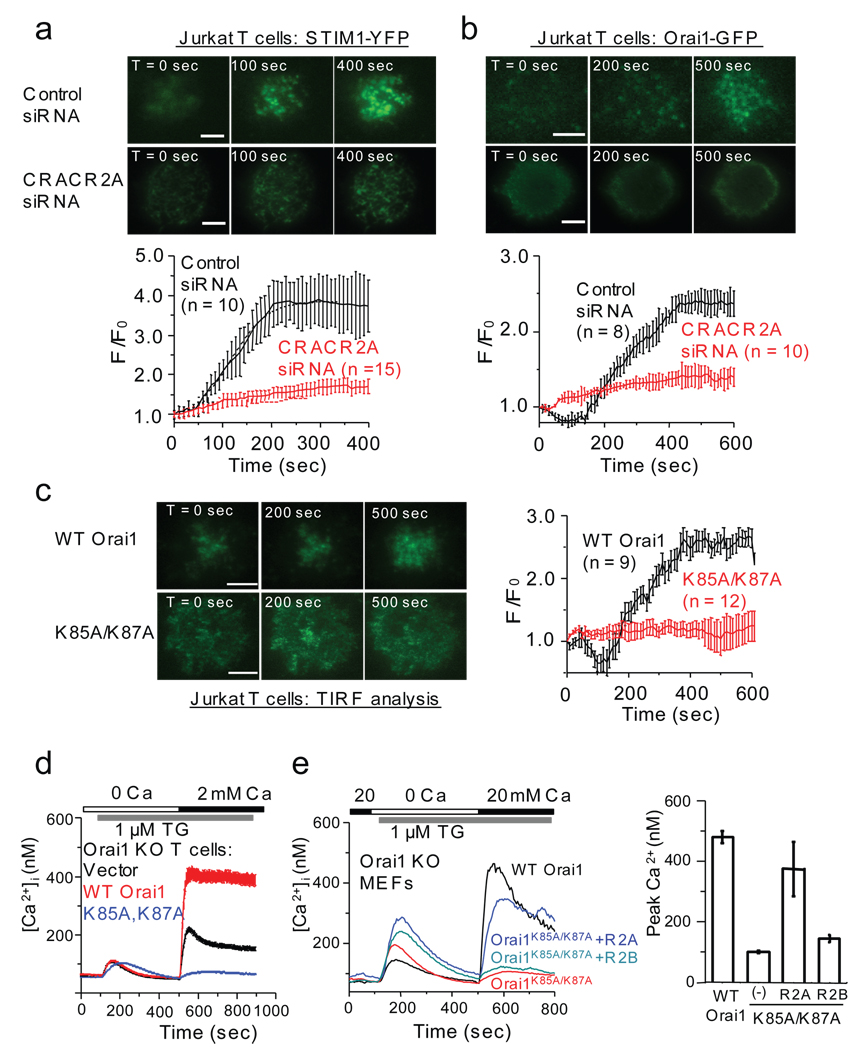
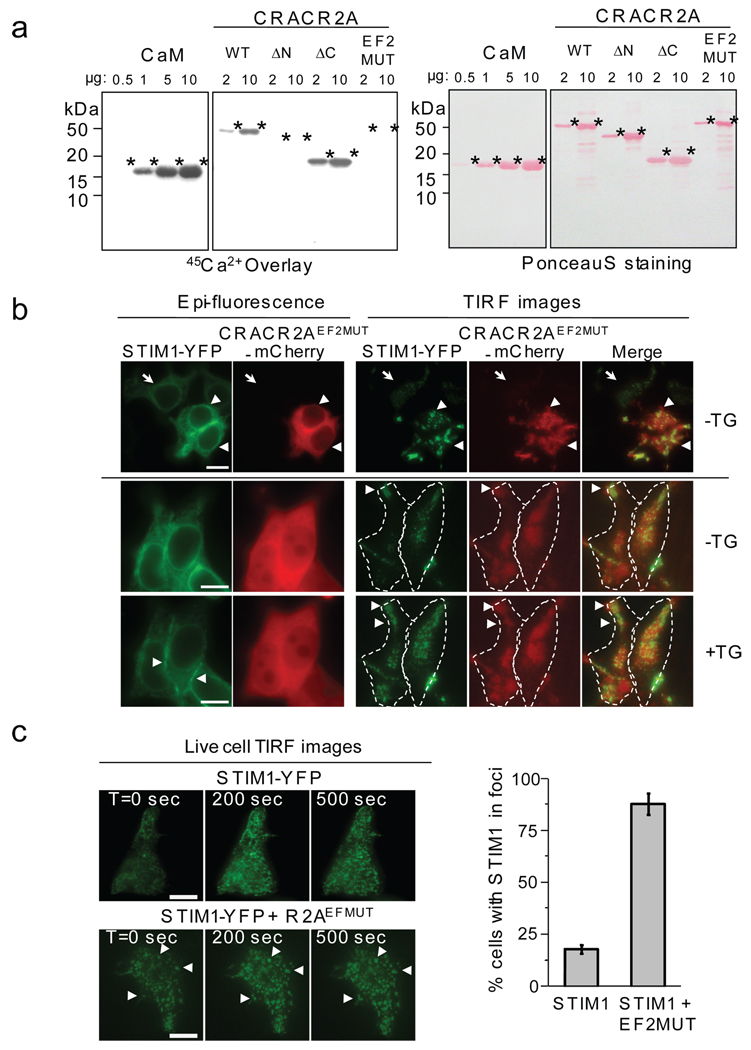
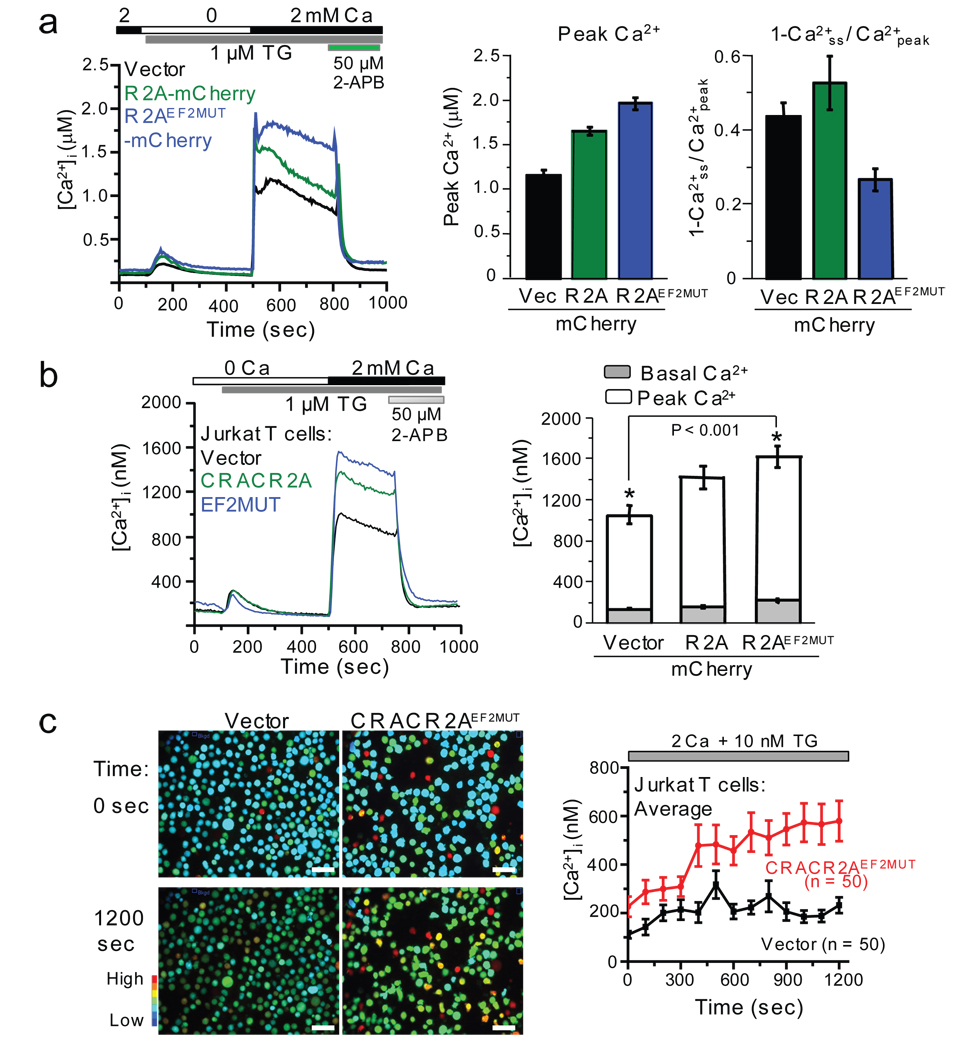
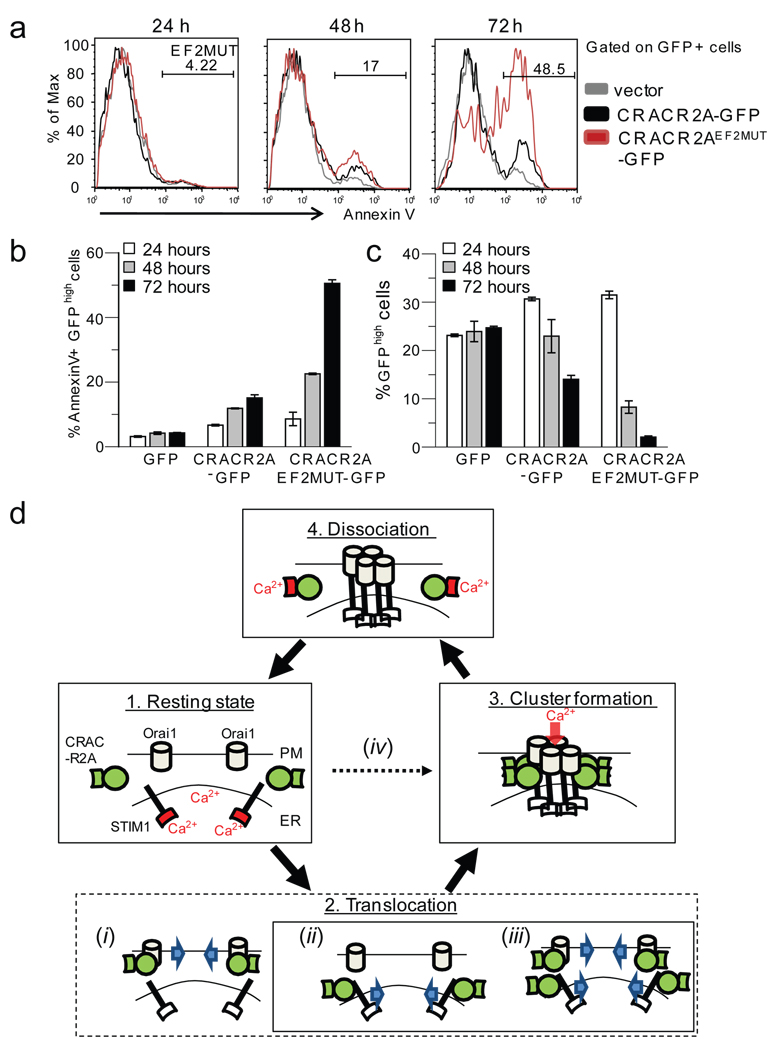
Orai1 and STIM1 are critical components of Ca(2+) release-activated Ca(2+) (CRAC) channels that mediate store-operated Ca(2+) entry (SOCE) in immune cells. Although it is known that Orai1 and STIM1 co-cluster and physically interact to mediate SOCE, the cytoplasmic machinery modulating these functions remains poorly understood. We sought to find modulators of Orai1 and STIM1 using affinity protein purification and identified a novel EF-hand protein, CRACR2A (also called CRAC regulator 2A, EFCAB4B or FLJ33805). We show that CRACR2A interacts directly with Orai1 and STIM1, forming a ternary complex that dissociates at elevated Ca(2+) concentrations. Studies using knockdown mediated by small interfering RNA (siRNA) and mutagenesis show that CRACR2A is important for clustering of Orai1 and STIM1 upon store depletion. Expression of an EF-hand mutant of CRACR2A enhanced STIM1 clustering, elevated cytoplasmic Ca(2+) and induced cell death, suggesting its active interaction with CRAC channels. These observations implicate CRACR2A, a novel Ca(2+) binding protein that is highly expressed in T cells and conserved in vertebrates, as a key regulator of CRAC channel-mediated SOCE.


Figures

Figure 1
Figure 1
Identification of CRACR2A as a binding partner of Orai1 by large-scale affinity purification. (a) CRAC currents measured in HeLa cells stably expressing Orai1 and STIM1 (HeLa O+S cells). Left panel shows inwardly rectifying CRAC currents (red trace) obtained by subtracting 2-APB inhibited currents (blue trace) from whole-cell currents (black trace). The pipette solution contained 12 mM EGTA to deplete the intracellular Ca2+ stores and the external solution contained 6 mM CaCl2. Right panel shows current-voltage relationships of the currents in divalent free (DVF, red trace) or 6 mM CaCl2 (black) containing solution. (b) Glycerol gradient fractionation of DSP cross-linked HeLa O+S cells in store-filled (top two panels) and store-depleted (bottom two panels) conditions. Different fractions were separated on SDS-PAGE and immunoblotted for detection of Orai1 (left) and STIM1 (right). * represents fractions enriched in Orai1 or STIM1 proteins. Arrowheads denote the fractions in which MW markers were detected. For full scans see Supplementary Information, Fig. S12. (c) Affinity purification of Orai1 protein complex. The glycerol gradient fractions enriched in FLAG-Orai1 were pooled and immunoprecipitated with anti-FLAG resin. After elution with the FLAG peptide, fractions were separated on SDS-PAGE and visualized by silver staining. * indicates protein bands enriched in store-filled or store-depleted conditions. (d) Schematic showing the predicted domain structure of human CRACR2A protein. Human CRACR2A contains 395 amino acids with two predicted EF-hand motifs (SMART program) in its N terminus and a predicted coiled-coil domain with leucine rich (LR) sequence in its C terminus (Human Protein Reference Database and COILS). The mutants used in the current study are indicated.
Figure 2
Figure 2
CRACR2A directly interacts with Orai and STIM1. (a) CRACR2A co-immunoprecipitates with Orai1 and STIM1. Left two panels: HeLa cells stably expressing either STIM1 (HeLa), or STIM1 and Orai1 (Orai1) were transfected with a plasmid encoding CRACR2A. After immunoprecipitation with anti-FLAG resin (Orai1) and elution with the FLAG peptide, eluted fractions were immunoblotted using anti-STIM1, anti-CRACR2A, and anti-FLAG (Orai1) antibodies. Right two panels: HeLa cells stably expressing STIM1 were transfected with plasmids encoding Myc-Orai1 alone (Vec) or together with FLAG-CRACR2A (CRACR2A). After immunoprecipitation with anti-FLAG resin (CRACR2A), precipitates were immunoblotted with anti-STIM1, anti-Myc (Orai1), and anti-FLAG (CRACR2A) antibodies. (b) CRACR2A directly binds to the N terminus of Orai1. Left panels: GST pulldown analysis was performed between full-length GST-Orai1 and 6× His-tagged CRACR2A or CRACR2AEF2MUT proteins in the presence or absence of 2 mM CaCl2 (left panels). Lower panel shows input levels of GST-Orai1. Right panels: pulldown analysis with GST-fused fragments of the N terminus (N-, amino acids 64–91), intracellular loop (intra, amino acids 137–173) and the C terminus (C-, amino acids 254–301) of Orai1 and full-length 6× His-tagged CRACR2A. Lower panel shows input levels of Orai1 fragments. All the recombinant proteins were purified from E. coli. (c) CRACR2A interacts with Orai2 and Orai3 proteins. HeLa cells stably expressing STIM1 were transfected with plasmids encoding FLAG-Orai2 (FO2, top) or FLAG-Orai3 (FO3, bottom) together with Myc-CRACR2A. Lysates were immunprecipitated with anti-FLAG resin and immunoblotted for detection of CRACR2A (anti-Myc, left, indicated with *) and Orai2 or Orai3 (anti-FLAG, right). NS, non-specific band. (d) Interaction between the cytoplasmic fragments of STIM1 and CRACR2A. A schematic of STIM1 with cytoplasmic domains of coiled-coil (CC, amino-acid residues 250–400), serine/threonine rich sequence (S/T, residues 400–600), and PEST sequence (residues 600–685) is shown. The CAD/SOAR fragment is indicated. Purified GST-fused STIM1 fragments were immunoblotted with anti-GST antibodies (left). Their interactions with purified full-length Orai1, CRACR2A, or STIM1 proteins were assessed by pulldown analysis in the absence (−Ca2+) or presence (+Ca2+) of 2 mM CaCl2. STIM1 fragments and CRACR2A were purified from E. coli, while full-length Orai1 and STIM1 proteins were purified from baculovirus infected insect cells. For full scans see Supplementary Information, Fig. S12.
Figure 3
Figure 3
CRACR2A plays an important role in Orai1-mediated SOCE in T cells. (a) SOCE measurements in Jurkat and HEK293 cells depleted of CRACR2A and CRACR2B. Top panel, averaged responses from Jurkat T cells: scrambled (Scr, n = 75 cells), CRACR2A (R2A, n = 79), or CRACR2B (R2B, n = 70) siRNAs. Bottom, averaged responses from HEK293 cells: Scr (n = 41), R2A (n = 47) or R2B (n = 49). Bar graphs represent averaged peak [Ca2+]i ± s.e.m. from three independent experiments. (b) Measurement of IL-2 expression in Jurkat T cells transfected with siRNAs. A representative of three independent experiments is shown. (c) Real-time PCR analysis of human CRACR2A and CRACR2B transcripts from various tissues and cell lines. Normalized mRNA levels are plotted relative to those of brain tissue. Data represent average ± s.d. from 2 independent experiments performed in triplicate. * indicates tissues or cell-lines showing high expression of CRACR2A transcripts, distinct from CRACR2B. (d) Expression of CRACR2A and CRACR2B in murine primary cells. The mRNA levels of CRACR2A or CRACR2B were measured from mouse embryonic fibroblasts (MEFs), thymocytes (Thy), naïve CD4+ T cells (Naïve), effector CD4+ (ThN), or CD8+ (CTL) T cells. Normalized mRNA levels are plotted relative to those of MEFs. N.D., not detected. Data represent average ± s.d. from 2 independent experiments performed in triplicate. (e) Examination of functional redundancy between CRACR2 proteins. SOCE was measured in HEK293 cells stably expressing control (Scr, black trace, n = 46 cells) or CRACR2B shRNA (red, n = 49). CRACR2B-depleted cells with ectopic expression of CRACR2A (R2A, blue, n = 41) or CRACR2B (R2B, cyan, n = 43) were examined for SOCE. A representative of three independent experiments is shown. The plasmids contain IRES-GFP and GFP+ cells were selected for analysis. (f) Effect of CRACR2 protein expression on Orai1-mediated SOCE. SOCE was measured in Orai1-null MEFs expressing CRACR2A or CRACR2B together with Orai1. Each trace shows averaged responses from 25 (vector), 30 (Orai1), 35 (Orai1+R2A) or 33 (Orai1+R2B) MEFs. The bar graph shows averaged peak [Ca2+]i ± s.e.m. from three independent experiments.
Figure 4
Figure 4
CRACR2A is essential for cluster formation of Orai1 and STIM1 in T cells. (a) TIRF microscopy images of STIM1-YFP in Jurkat T cells transfected with either control (top panel) or CRACR2A siRNA (bottom panel). Cells were imaged in Ca2+ free Ringer solution and ER Ca2+ was depleted with 1 µM of thapsigargin at the initial time point (T = 0). The graph below represents an average of normalized fluorescence intensity ± s.e.m. from measurements of 10 cells transfected with control siRNA (black) and 15 cells transfected with CRACR2A siRNA (red). Bar, 5 µm. (b) Clustering of Orai1-GFP in Jurkat T cells co-expressing STIM1-mCherry. Cells were transfected with control siRNA (top panel) or CRACR2A siRNA (bottom panel). Jurkat cells expressing both Orai1 and STIM1 proteins were imaged by TIRF microscopy. The graph below represents an average of normalized fluorescence intensity ± s.e.m. from measurements of 8 cells transfected with control siRNA and 10 cells transfected with CRACR2A siRNA. Bar, 5 µm. (c) TIRF microscopy analysis of Orai1K85A/K87A-GFP in Jurkat T cells. Jurkat T cells expressing STIM1-mCherry and wild type Orai1-GFP or Orai1K85A/K87A-GFP were imaged. The graph represents an average of normalized fluorescence intensity ± s.e.m. from 9 cells expressing Orai1-GFP and 12 cells expressing Orai1K85A/K87A-GFP. Bar, 5 µm. (d) Reconstitution of SOCE in Orai1-null CD4+ T cells by expression of WT Orai1 or Orai1K85A/K87A. T cells transduced with retroviral vectors expressing WT Orai1 or Orai1K85A/K87A together with GFP from an IRES site were examined for SOCE. Each trace shows average ± s.e.m. from 70 (vector), 77 (WT Orai1), or 79 (K85A, K87A) GFP+ cells. A representative of three independent experiments is shown here. (e) Recovery of defect in SOCE of Orai1K85A/K87A mutant by co-expression of CRACR2 proteins. Orai1-null MEFs were transduced with retroviruses encoding CRACR2A or CRACR2B together with Orai1K85A/K87A for measurement of SOCE. Each trace shows averaged responses from 35 (Orai1K85A/K87A), 32 (WT Orai1), 30 (Orai1K85A/K87A + R2A) or 39 (Orai1K85A/K87A + R2B) GFP+ MEFs. The bar graph shows averaged peak [Ca2+]i ± s.e.m. from three independent experiments.
Figure 5
Figure 5
An EF-hand mutant of CRACR2A causes spontaneous clustering of STIM1. (a) CRACR2A binds Ca2+ via its EF-hands. 45Ca2+ overlay experiments were performed with purified full-length CRACR2A, CRACR2A truncated in its N terminus (ΔN, amino acids 119–395), C terminus (ΔC, amino acids 1–154), or mutated in its EF-hand2 (EF2MUT). 2 or 10 µg of each protein were used to examine Ca2+ binding. Similar amount of purified calmodulin (CaM) was run (left panel) to compare Ca2+ binding affinity. Compare Ca2+ binding of CaM with ΔC mutant of CRACR2A for similar molar concentrations of each protein. Panels on the right show Ponceau S staining of the same blots to compare protein amounts. (b) Live cell epifluorescence and TIRF microscopy analysis of HEK293 cells expressing STIM1-YFP and CRACR2AEF2MUT-mCherry in the absence or presence of store depletion. Left panels show epifluorescence images from the middle of the cell and right panels show TIRF images from the footprint of the cell. Arrowheads in the top panel show clustering of STIM1-YFP in cells co-expressing CRACR2AEF2MUT. An arrow in the same panel depicts minimal clustering in a cell expressing only STIM1-YFP. Arrowheads in the bottom TIRF panels show co-accumulation of CRACR2AEF2MUT-mCherry with STIM1-YFP at sites of newly formed clusters after store depletion (+TG). Bar, 10 µm. (c) TIRF microscopy analysis of HEK293 cells expressing STIM1-YFP in the absence (top) or presence (bottom) of CRACR2AEF2MUT. Cells co-expressing mCherry (top) or CRACR2AEF2MUT-mCherry (bottom) were selected. CRACR2AEF2MUT induced clustering of STIM1-YFP without ER Ca2+ depletion (compare images at T = 0 s in the top and bottom panels). Thapsigargin was added at T = 0 s and images of STIM1 clustering are shown at 200 and 500 s. Arrowheads represent preformed clusters of STIM1 that expand upon store depletion. Bar graph depicts averaged number of HEK293 cells (± s.d.) showing STIM1 clustering in the presence (n = 112 cells) or absence (n = 106) of CRACR2AEF2MUT. Cells moderately expressing STIM1-YFP were examined. Bar, 10 µm.
Figure 6
Figure 6
CRACR2A regulates SOCE and CRAC channel-mediated Ca2+ oscillations in T cells. (a) Measurement of SOCE in HeLa O+S cells expressing CRACR2A. Averaged responses from HeLa O+S cells expressing mCherry (n = 33 cells), CRACR2A-mCherry (n = 36), or CRACR2AEF2MUT-mCherry (n = 39) are shown. Bar graph shows peak [Ca2+]i values immediately upon addition of 2 mM Ca2+ (Left). A decrease in sustained [Ca2+]i is plotted as 1-Ca2+ss / Ca2+peak, where Ca2+ss represents steady state [Ca2+]i at 800 sec and Ca2+peak represents the peak [Ca2+]i (right). Bar graphs show average ± s.e.m. from three independent experiments. (b) Measurement of SOCE in Jurkat T cells expressing CRACR2A. Averaged responses from cells expressing mCherry (n = 55 cells), CRACR2A-mCherry (n = 50), or CRACR2AEF2MUT-mCherry (n = 60) are shown. Bar graph depicts average ± s.e.m. of [Ca2+]i before (basal, gray bars) and after (peak, open bars) store depletion from three independent experiments. * represents statistically significant differences in resting and stimulated [Ca2+]i (P < 0.001 by t-test). (c) Expression of CRACR2AEF2MUT in Jurkat T cells disrupts normal Ca2+ oscillations induced by thapsigargin. Jurkat T cells expressing mCherry or CRACR2AEF2MUT-mCherry were treated with 10 nM thapsigargin in 2 mM Ca2+ containing Ringer solution to induce asynchronous [Ca2+]i oscillations. Left panel shows pseudocolored images of transfected cells for [Ca2+]i (>70% transfection efficiency in each case) and right panel shows the traces of [Ca2+]i oscillations averaged from 50 cells. Data are representative of three independent experiments. Bar, 50 µm.
Figure 7
Figure 7
Expression of EF-hand mutant of CRACR2A induces cell death in Jurkat T cells. (a) Cell death induced by CRACR2A overexpression in T cells. Jurkat T cells expressing GFP, CRACR2A-GFP or CRACR2AEF2MUT-GFP were examined for cell death by Annexin V staining at 24, 48, and 72 h after transfection. One representative from three independent experiments is shown. (b) Quantification of the data shown in (a). Bar graphs represent average ± s.e.m. from three independent experiments. (c) Live cell population is reduced in Jurkat cells expressing CRACR2AEF2MUT-GFP. Jurkat T cells expressing GFP, CRACR2A-GFP or CRACR2AEF2MUT-GFP were assessed for percent of live, GFP-positive populations at 24, 48 and 72 h after transfection. Cells with high expression of GFP (GFPhigh) were analyzed by flow cytometry. Data represents average ± s.e.m. from three independent experiments. (d) A proposed model showing possible role(s) of CRACR2A in CRAC channel function. Under resting conditions, Orai1 and STIM1 are distributed at the PM and ER membranes, respectively (1. Resting state) while CRACR2A (green) localizes in the cytoplasm. Upon store depletion, Orai1 and STIM1 translocate to form clusters at the junctional regions between PM and ER (State 2). CRACR2A may either be actively involved in translocation of Orai1 (i), STIM1 (ii) or both (iii). It is also possible that CRACR2A passively interacts with Orai1 and STIM1 at sites of clustering (iv). Based on our data, we propose that CRACR2A is important for stabilization of Orai1- STIM1 complex via direct protein interaction under physiological conditions where amounts of Orai1 and STIM1 proteins are limiting (State 3). Upon increase of cytoplasmic [Ca2+] via opening of CRAC channels, the EF hands of CRACR2A bind Ca2+ ions, resulting in its dissociation from Orai1 and STIM1 (State 4), thereby destabilizing the Orai1-STIM1 complex. The EF-hands of STIM1 and CRACR2A are indicated and their Ca2+-bound status is colored in red. The schematic does not represent molecular stoichiometry of Orai1, STIM, and CRACR2A proteins.

Comment in

  • Cracking CRAC.
    Carrasco S, Meyer T. Carrasco S, et al. Nat Cell Biol. 2010 May;12(5):416-8. doi: 10.1038/ncb0510-416. Nat Cell Biol. 2010. PMID: 20442700 Free PMC article.

References

    1. Feske S. Calcium signalling in lymphocyte activation and disease. Nat Rev Immunol. 2007;7:690–702. - PubMed
    1. Vig M, Kinet JP. Calcium signaling in immune cells. Nat Immunol. 2009;10:21–27. - PMC - PubMed
    1. Gwack Y, Feske S, Srikanth S, Hogan PG, Rao A. Signalling to transcription: store-operated Ca2+ entry and NFAT activation in lymphocytes. Cell Calcium. 2007;42:145–156. - PubMed
    1. Lewis RS. Calcium signaling mechanisms in T lymphocytes. Annu Rev Immunol. 2001;19:497–521. - PubMed
    1. Cahalan MD, Chandy KG. The functional network of ion channels in T lymphocytes. Immunol Rev. 2009;231:59–87. - PMC - PubMed

Publication types

Associated data