. 2010 May;13(5):541-550.
doi: 10.1038/nn.2536. Epub 2010 Apr 25.

Chordin-induced lineage plasticity of adult SVZ neuroblasts after demyelination

Affiliations

Chordin-induced lineage plasticity of adult SVZ neuroblasts after demyelination

Beata Jablonska et al. Nat Neurosci. 2010 May.

Abstract

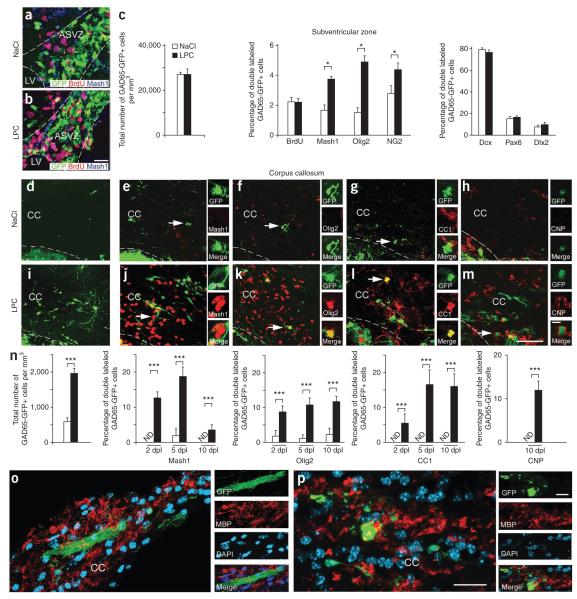
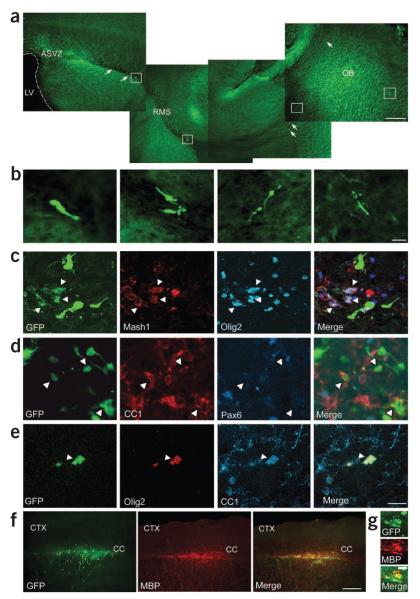
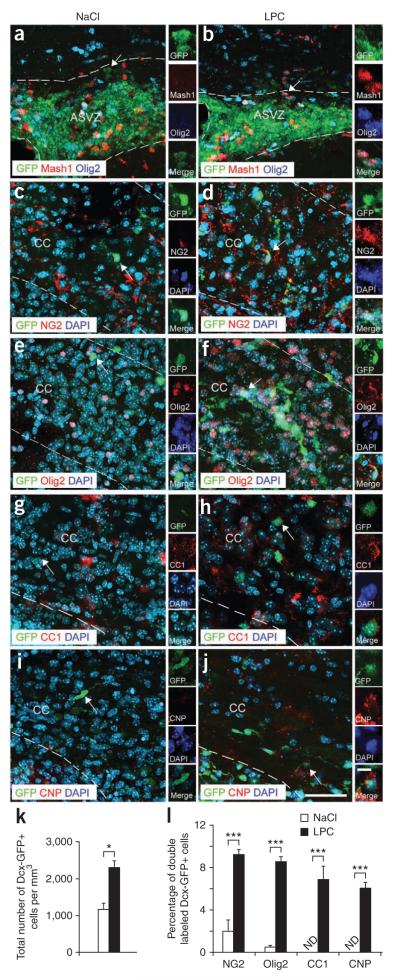
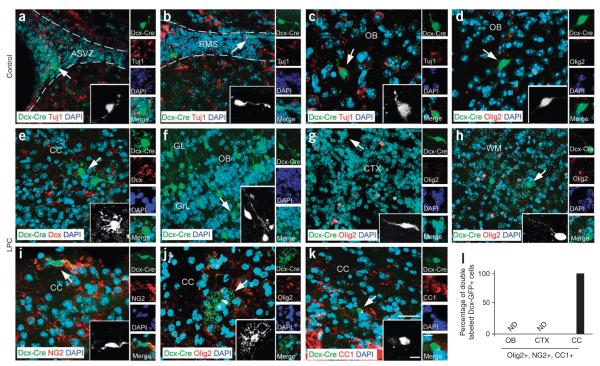
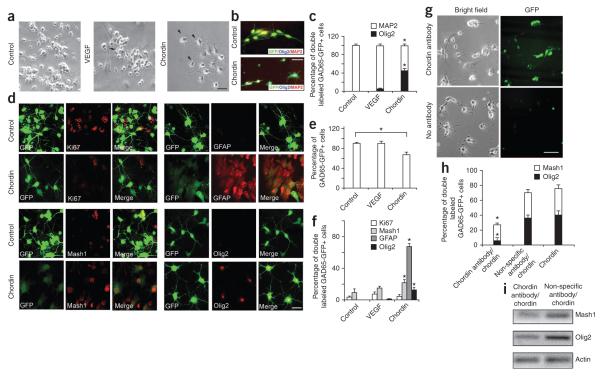
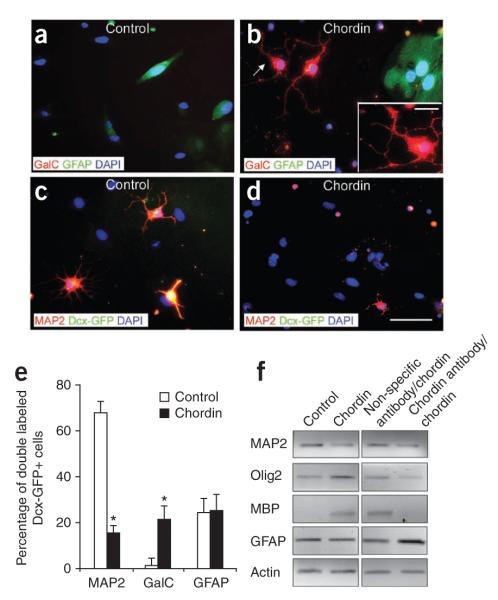
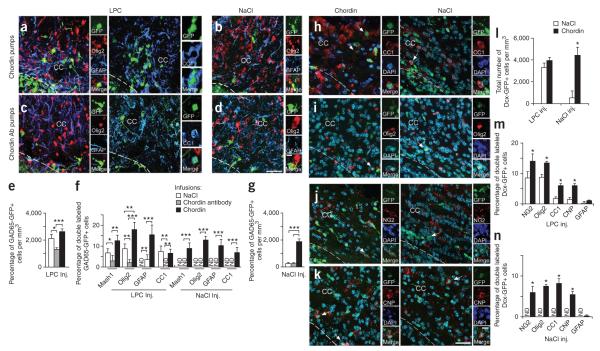
The mechanisms that regulate the developmental potential of adult neural progenitor populations under physiological and pathological conditions remain poorly defined. Glutamic acid decarboxylase 65 (GAD65)- and Doublecortin (Dcx)-expressing cells constitute major progenitor populations in the adult mouse subventricular zone (SVZ). Under normal physiological conditions, SVZ-derived GAD65-positive and Dcx-positive cells expressed the transcription factor Pax6 and migrated along the rostral migratory stream to the olfactory bulb to generate interneurons. After lysolecithin-induced demyelination of corpus callosum, however, these cells altered their molecular and cellular properties and migratory path. Demyelination upregulated chordin in the SVZ, which redirected GAD65-positive and Dcx-positive progenitors from neuronal to glial fates, generating new oligodendrocytes in the corpus callosum. Our findings suggest that the lineage plasticity of SVZ progenitor cells could be a potential therapeutic strategy for diseased or injured brain.


Figures

Figure 1
Figure 1
Demyelination increases GAD65-GFP–positive cells expressing glial lineage markers in the SVZ and corpus callosum. (a,b) GAD65-GFP–positive cells in the anterior subventricular zone (ASVZ) immunolabeled with antibodies to BrdU and Mash1 after NaCl (a) or LPC (b) injection at 5 dpl. Dotted lines bound ASVZ and lateral ventricle (LV). Scale bar represents 50 μm. (c) Total number of GAD65-GFP–positive cells does not change after LPC injections (n = 8 brains). Percentages of double-labeled GAD65-GFP–positive cells stained with antibodies to BrdU, Mash1, Olig2, NG2, Dcx, Pax6 and Dlx2 after LPC injections (n = 4 brains, *P < 0.05, t test). (dm) Images of GAD65-GFP–positive cells in NaCl-injected (dh) and LPC-injected (im) corpus callosum (CC) at 10 dpl. Cells were colabeled with antibodies to Mash1 (e,j), Olig2 (f,k), CC1 (g,l) or CNP (h,m). Dotted lines bound corpus callosum. Insets magnify cells indicated by arrows. Scale bar represents 50 μm. (n) Density of GAD65-GFP–positive cells in LPC- and NaCl-injected corpus callosum. Shown are the percentages of GAD65-GFP–positive and Mash1-positive, GAD65-GFP–positive and Olig2-positive, GAD65-GFP–positive and CC1-positive, and GAD65-GFP–positive and CNP-positive cells in LPC- and in NaCl-injected corpus callosum. ND, not detectable. Bar graphs represent means ± s.e.m. (n = 4–8 brains, ***P < 0.02, t test). (o,p) Images of GAD65-GFP–positive cells in LPC-injected corpus callosum at 14 dpl. GAD65-GFP–positive, MBP-positive oligodendrocytes were detected only in LPC-injected corpus callosum. Scale bars represent 50 μm.
Figure 2
Figure 2
Demyelination alters the migratory pathway and phenotype of GAD65-GFP–positive cells. (a) Confocal images of a sagittal brain section showing migratory pathway of GAD65-GFP–positive progenitor cells from the SVZ to the olfactory bulb (OB) along the RMS. Under normal conditions, GAD65-GFP–positive cells were found exclusively in the olfactory bulb; none migrated to the corpus callosum. Scale bar represents 400 μm. (b) Magnification of RMS GAD65-GFP–positive cells in white boxes, showing their neuronal morphology. Scale bar represents 20 μm. (ce) At 14 dpl GAD65-GFP–positive cells in demyelinated corpus callosum coexpressed Mash1, Olig2 and CC1, but not Pax6. White arrowheads indicate GAD65-GFP–positive cells colabeled with different markers. Scale bar represents 20 μm. (f) Images show GAD65-GFP–positive cells immunolabeled with antibody to MBP in demyelinated corpus callosum at 14 dpl. CTX, cerebral cortex. Scale bar represents 400 μm. (g) Higher magnification of GAD65-GFP–positive cells colabeled with antibody to MBP in demyelinated corpus callosum. Scale bar represents 400 μm.
Figure 3
Figure 3
Cellular characterization of the corpus callosum in Dcx-GFP mice after demyelination. (aj) Images of Dcx-GFP–positive cells in the ASVZ (a,b) at 5 dpl and in corpus callosum (cj) at 10 dpl after NaCl (a,c,e,g,i) and LPC (b,d,f,h,j) injections. Cells were labeled with antibodies to Mash1 and Olig2 (a,b), NG2 (c,d), Olig2 (e,f), CC1 (g,h) and CNP (i,j), together with DAPI. Insets magnify cells indicated by arrows. Dotted lines bound ASVZ and corpus callosum. Scale bars represent 50 μm. (k) The total number of Dcx-GFP–positive cells increased in the corpus callosum after LPC injection at 10 dpl. Bar graphs represent means ± s.e.m. (n = 4 brains, *P < 0.02, t test). (l) Percentages of Dcx-GFP–positive cells colabeled with antibodies to NG2, Olig2, CC1 and CNP in LPC- and NaCl-injected corpus callosum at 10 dpl. Mature oligodendrocytes stained with antibodies to CC1 and CNP were detected in corpus callosum after demyelination. Bar graphs represent means ± s.e.m. (n = 4 brains, ***P < 0.05, t test).
Figure 4
Figure 4
Cell lineage plasticity of Dcx-expressing progenitors after demyelination. (ak) Confocal images of ASVZ (a,e), RMS (b), olfactory bulb (c,d,f), cortex (g), white matter (WM, h) and CC (ik) from NaCl- (ad) and LPC-injected (ek) Dcx-CreERT2 brains at 7 dpl. Tissue sections were stained with antibodies to Tuj1 (ac), Dcx (e), Olig2 (d,g,h,j), NG2 (i) and CC1 (k). In the Dcx-CreERT2 mouse, all of the Dcx-CreERT2–GFP–positive cells had neuronal bipolar morphology and expressed the Tuj1 neuronal marker 2 d after tamoxifen injection. In LPC-injected Dcx-CreERT2 brains, Dcx-CreERT2– GFP–positive cells had neuronal morphology in cortex, olfactory bulb and white matter, whereas Dcx-CreERT2–GFP–positive cells had oligodendrocyte morphology and expressed oligodendrocyte markers in corpus callosum. Scale bars represent 200 μm (a,b), 100 μm (ck) and 50 μm (insets). Black and white insets magnify cells indicated by arrows. (l) Graph represents the percentage of Dcx-CreERT2–GFP–positive cells expressing Olig2, NG2 or CC1 in the olfactory bulb, cortex and corpus callosum. No oligodendrocyte lineage cells were found in the olfactory bulb and cortex, whereas in corpus callosum all Dcx-CreERT2–GFP–positive cells expressed oligodendrocyte markers. The bar graph shows means ± s.e.m. (n = 3 brains for each, NaCl and LPC injection, ***P < 0.05, t test).
Figure 5
Figure 5
GAD65-GFP–positive cells from the SVZ of LPC-injected brains generate Olig2- and GalC-positive cells in culture. (a) Bright field (left) and fluorescence (right) images of cultured FACS-purified SVZ GAD65-GFP–positive cells from NaCl- or LPC-injected brains. Arrows indicate GAD65-GFP–positive cells with neuronal (cultures from NaCl-injected brains) or oligodendrocytic (cultures from LPC-injected brains) morphologies. Scale bar represents 50 μm. (b) Images of FACS-purified SVZ GAD65-GFP–positive cells from NaCl- and LPC-injected brains cultured for 5 d and immunostained with antibodies to MAP2, GalC, Mash1 or Olig2. Scale bar represents 30 μm. (c) Percentages of GAD65-GFP–positive cells expressing MAP2, Mash1, Olig2 and GalC in 5-d cultures obtained from SVZ cells of NaCl- or LPC-injected brains. Cultures from NaCl-injected brains consisted of 100% MAP2-positive cells; no Olig2- or GalC-positive cells were detected. A percentage of MAP2-positive cells coexpressed Mash1. Cultures from LPC-injected brains consisted of GAD65-GFP–positive, Olig2-positive cells and GAD65-GFP–positive, GalC-positive cells. Bar graphs represent means ± s.e.m. (n = 3 independent cultures, *P < 0.05, **P < 0.03, t test).
Figure 6
Figure 6
Chordin induces cell lineage plasticity in cultured SVZ GAD65-GFP–positive cells. Cultures were processed at 5 d. (a) FACS-sorted SVZ GAD65-GFP–positive cells cultured in basal medium and with VEGF or chordin. Arrows indicate oligodendrocytes. Scale bar represents 20 μm. (b) GAD65-GFP–positive cells immunostained with antibodies to Olig2 and MAP2. Scale bar represents 20 μm. (c) Percentages of GAD65-GFP–positive, MAP2-positive cells and GAD65-GFP–positive, Olig2-positive cells in designated cultures. Bar graphs represent means ± s.e.m. (n = 3 independent cultures, *P < 0.05, t test). (d) FACS-sorted SVZ GAD65-GFP–positive cells cultured in basal medium with or without chordin. GAD65-GFP–positive cells immunostained with antibodies to Ki67, Mash1, GFAP or Olig2. Scale bar represents 20 μm. (e) Percentages of total GAD65-GFP–positive cells under different culture conditions. Means ± s.e.m. are shown (n = 3 independent cultures, *P < 0.05, t test). (f) Percentages of total GAD65-GFP–positive cells that express Ki67, Mash1, GFAP or Olig2 in basal medium in the presence of VEGF or chordin. Means ± s.e.m. are shown (n = 3 independent cultures, **P < 0.03, t test). (g) FACS-purified SVZ GAD65-GFP–positive cells cultured with chordin and either antibody to chordin or with a nonspecific IgG antibody. Scale bar represents 40 μm. (h) Percentages of GAD65-GFP–positive, Mash1-positive cells and GAD65-GFP–positive, Olig2-positive cells in chordin-treated cultures compared with cells cultured with nonspecific antibody and chordin or chordin alone. Means ± s.e.m. are shown (n = 3 independent cultures, t test). (i) RT-PCR from FACS-purified SVZ GAD65-GFP–positive cells maintained in culture in the presence of chordin.
Figure 7
Figure 7
Chordin induces cell lineage plasticity in cultured SVZ Dcx-GFP–positive cells. (ad) Dcx-GFP–positive cells FACS purified from the adult SVZ were cultured for 5 d in basal medium (a,c) and in medium with chordin and antibody to chordin (b,d). Cells were stained with anti-GFAP, anti-GalC and anti-MAP2 antibodies. Scale bars represent 20 μm and 50 μm (inset). Inset magnifies oligodendrocyte indicated by arrow. (e) Chordin decreased the percentage of Dcx-GFP–positive cells expressing MAP2 and increased the percentage of Dcx-GFP–positive, GalC-positive cells in the cultures. The percentage of Dcx-GFP–positive, GFAP-positive astrocytes remained unchanged. Bar graphs represent means ± s.e.m. (n = 3 independent cultures, *P < 0.05, t test). (f) RT-PCR from Dcx-GFP–positive cells FACS purified from the adult SVZ and cultured for 5 d. Upregulation of Olig2 and Mbp expression was detected after treatment with chordin. No substantial changes were observed in Gfap expression. Treatment with antibody to chordin downregulates Olig2 and Mbp genes.
Figure 8
Figure 8
Chordin induces oligodendrogenesis in corpus callosum of GAD65-GFP and Dcx-GFP mice after demyelination. (ad) LPC- (a,c) or NaCl-injected (b,d) corpus callosum of GAD65-GFP mice at 10 dpl. GAD65-GFP–positive cells colabeled with antibody to Olig2, CC1 and GFAP after chordin (a) or antibody to chordin (b) infusion. Scale bar represents 50 μm. (e) GAD65-GFP–positive cell numbers after NaCl, chordin and antibody to chordin infusion in LPC-injected corpus callosum. Bars represent means ± s.e.m. (n = 4 brains per condition, *P < 0.05, ***P < 0.02, t test). (f) Percentages of GAD65-GFP–positive cells expressing glial markers in LPC- and NaCl-injected corpus callosum. Bars represent means ± s.e.m. (n = 4 brains per condition, **P < 0.03, t test). (g) GAD65-GFP–positive cell numbers after NaCl, chordin and antibody to chordin infusion in NaCl-injected corpus callosum. Bars represent means ± s.e.m. (n = 4 brains per condition, t test). Dcx–GFP–positive cells colabeled with antibodies to CC1 (h), Olig2 (i), NG2 (j) and CNP (k) in LPC-injected Dcx-GFP brains after chordin or NaCl infusion at 10 dpl. Scale bars represent 50 μm. (l) Dcx-GFP–positive cell number after NaCl and chordin infusion in corpus callosum of LPC- and NaCl-injected brains. Bars represent means ± s.e.m. (n = 4 brains per condition, t-test). (m) Percentages of Dcx-GFP–positive cells expressing NG2 or glial markers in LPC-injected brains after NaCl or chordin infusion. Bars represent means ± s.e.m. (n = 4 brains per condition, t test). (n) Percentages of Dcx-GFP–positive cells expressing NG2 or glial markers in NaCl-injected brains after NaCl or chordin infusion. Bars represent means ± s.e.m. (n = 4 brains per condition, t test). Dotted lines define lesion boundaries. The cells indicated arrows are magnified in insets.

References

    1. Doetsch F, Garcia-Verdugo JM, Alvarez-Buylla A. Regeneration of a germinal layer in the adult mammalian brain. Proc. Natl. Acad. Sci. USA. 1999;96:11619–11624. - PMC - PubMed
    1. Palmer TD, Markakis EA, Willhoite AR, Safar F, Gage FH. Fibroblast growth factor 2 activates a latent neurogenic program in neural stem cells from diverse regions of the adult CNS. J. Neurosci. 1999;19:8487–8497. - PMC - PubMed
    1. Palmer TD, Willhoite AR, Gage FH. Vascular niche for adult hippocampal neurogenesis. J. Comp. Neurol. 2000;425:479–494. - PubMed
    1. Temple S. The development of neural stem cells. Nature. 2001;414:112–117. - PubMed
    1. Shen Q, Zhong W, Jan YN, Temple S. Asymmetric Numb distribution is critical for asymmetric cell division of mouse cerebral cortical stem cells and neuroblasts. Development. 2002;129:4843–4853. - PubMed

Publication types

MeSH terms

Associated data