. 2010 May;17(5):620-8.
doi: 10.1038/nsmb.1801. Epub 2010 Apr 25.

Human RNA polymerase III transcriptomes and relationships to Pol II promoter chromatin and enhancer-binding factors

Affiliations

Human RNA polymerase III transcriptomes and relationships to Pol II promoter chromatin and enhancer-binding factors

Andrew J Oler et al. Nat Struct Mol Biol. 2010 May.

Abstract

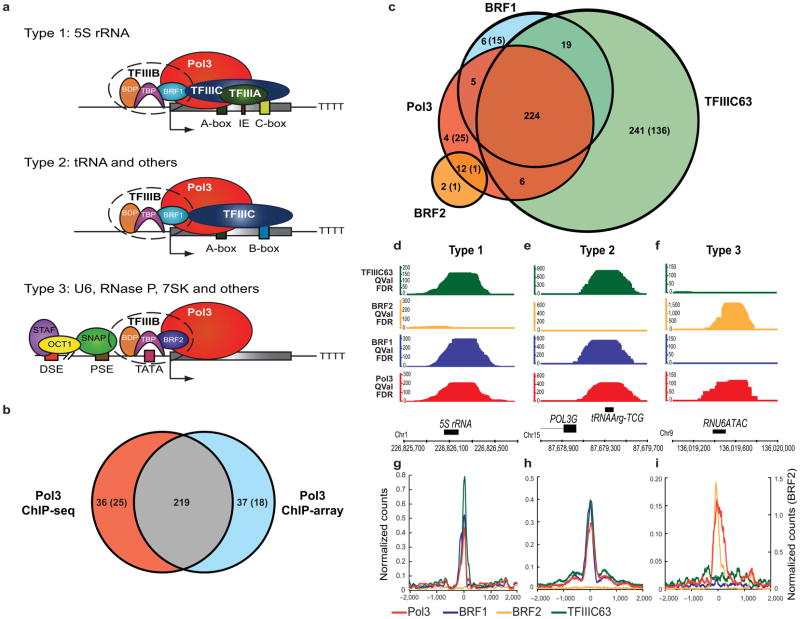
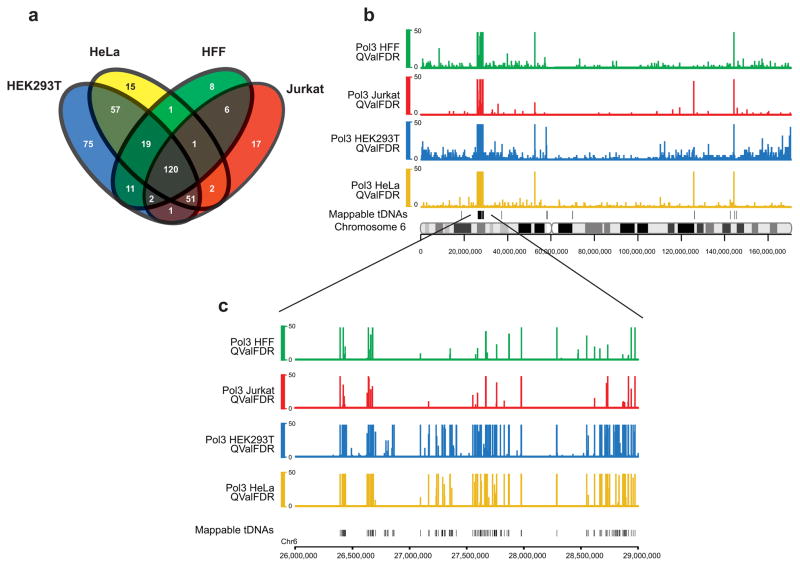
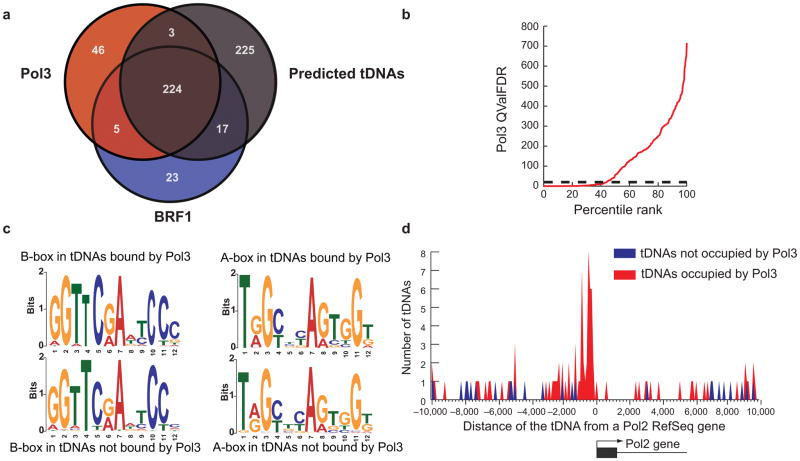
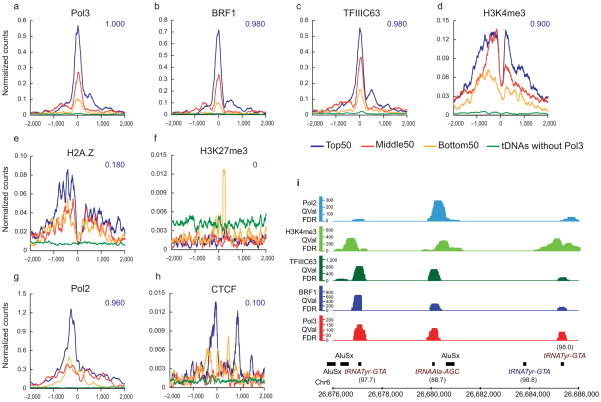
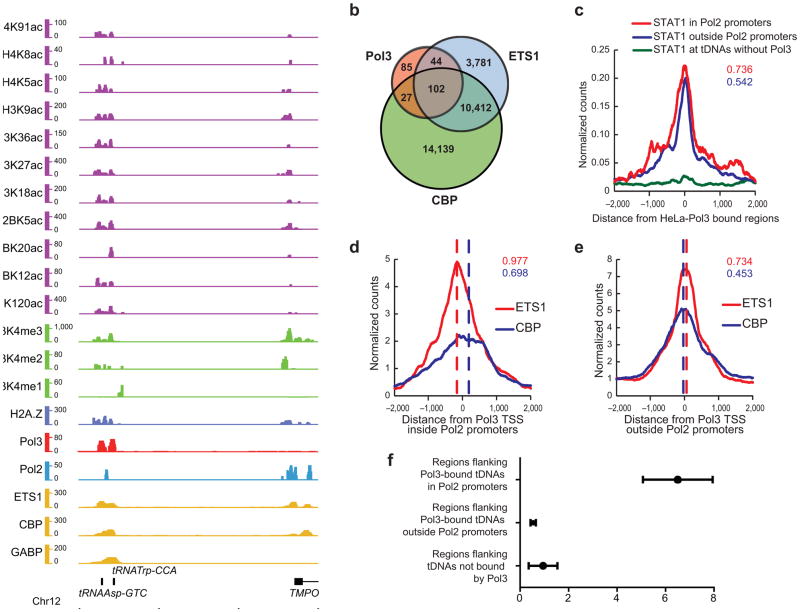
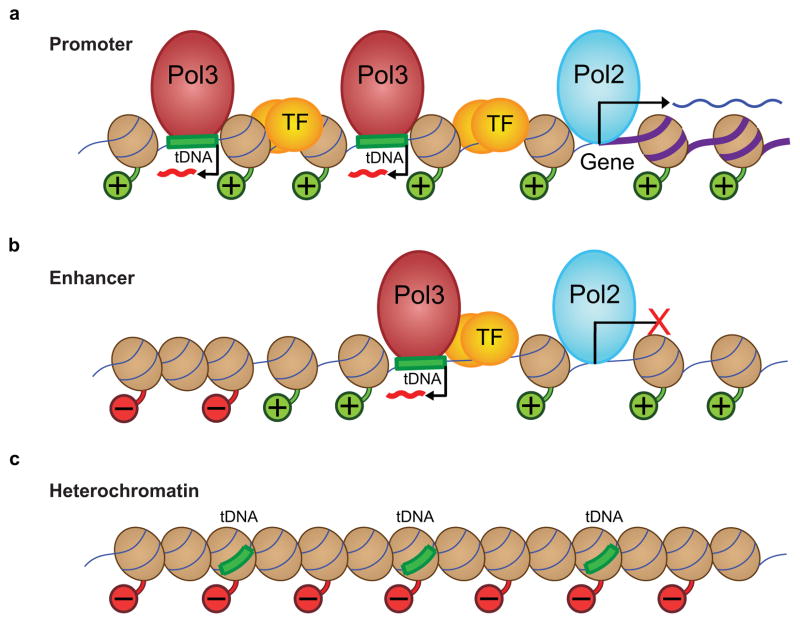
RNA polymerase (Pol) III transcribes many noncoding RNAs (for example, transfer RNAs) important for translational capacity and other functions. We localized Pol III, alternative TFIIIB complexes (BRF1 or BRF2) and TFIIIC in HeLa cells to determine the Pol III transcriptome, define gene classes and reveal 'TFIIIC-only' sites. Pol III localization in other transformed and primary cell lines reveals previously uncharacterized and cell type-specific Pol III loci as well as one microRNA. Notably, only a fraction of the in silico-predicted Pol III loci are occupied. Many occupied Pol III genes reside within an annotated Pol II promoter. Outside of Pol II promoters, occupied Pol III genes overlap with enhancer-like chromatin and enhancer-binding proteins such as ETS1 and STAT1. Moreover, Pol III occupancy scales with the levels of nearby Pol II, active chromatin and CpG content. These results suggest that active chromatin gates Pol III accessibility to the genome.


Figures

Figure 1
Figure 1
Occupancy analysis of Pol III and associated machinery in HeLa cells. (a) Pol III transcribed genes are classified into three Types based on sequence elements and transcription factors. IE, intermediate element. See Introduction for details. (b) Comparison of Pol III enriched regions obtained by ChIP-array (threshold 8.5-fold over background) and ChIP-seq (FDR<1%). Most sites appearing unique in the ChIP-array can be explained by data thresholding; they are scored as occupied after lowering the threshold for Pol III in the ChIP-seq format, and meet the high threshold (FDR<1%) in ChIP-seq experiments with other Pol III factors (TFIIIB or TFIIIC). (c) Intersections of Pol III-enriched regions (FDR<1%) with regions enriched by the basal transcription machinery (BRF1, BRF2 and TFIIIC; FDR<1%). In the Venn diagrams, the numbers outside parentheses denote known annotated Pol III genes, whereas the numbers within parentheses denote novel Pol III targets. (d–f) Genomic visualization of one random example of each of the three Types of Pol III genes. The y-axis depicts QValFDR significance values, which correspond to p-values (50=10−5, 100=10−10). Values are depicted for Pol III (red), BRF1 (blue), BRF2 (yellow) and TFIIIC63 (green). The x-axis is the physical map (hg18). (g–i) Class average maps of Pol III (red), BRF1 (blue), BRF2 (yellow) and TFIIIC63 (green) at Type 1, Type 2 and Type 3 genes. The y-axis is the number of read counts at each nucleotide normalized to the number of genes in the class. The x-axis is the distance from the transcription start site (TSS) of the Pol III gene.
Figure 2
Figure 2
Differential Pol III occupancy in various cell types. (a) Intersection analysis of the known Pol III occupied genes between the four cell types. Pol III bound regions (top 400 enriched loci) were filtered for unannotated regions and only known genes were used for the analysis. Total numbers of genes for HEK293T, HeLa, Jurkat, and HFF were 336, 266, 200, and 168, respectively. (b) A snapshot of chromosome 6 showing Pol III occupancy in HeLa (yellow), HEK293T (blue), Jurkat (red) and Human Foreskin Fibroblasts (HFF, green) and mappable tDNAs on a separate track. (c) A zoomed-in view of a tDNA cluster in 6p22.1 showing Pol III occupancy in the four cell types. Note that many tDNAs are differentially enriched with Pol III between cell types.
Figure 3
Figure 3
Genomic features of Pol III-occupied and unoccupied tDNAs in HeLa cells. (a) Venn Diagram illustrating that predicted tDNAs are bound by Pol III or Pol III transcription factors (BRF1). These 469 tDNAs represent 467 mappable, predicted tDNAs plus two Pol III-enriched tRNA-pseudogenes. (b) All predicted mappable tDNAs were ranked by their Pol III occupancy (x-axis) and plotted against Pol III QValFDR (y-axis), to show that ~50% of tDNAs are unoccupied by Pol III. The dotted line represents FDR 1% cutoff (QValFDR 20). (c) Sequence Discovery (MEME) analysis of the regulatory sequence elements (A-box and B-box) of tDNAs bound or not bound by Pol III. Note that the sequences are nearly identical between the two classes of tDNAs. (d) Pol III bound (red) or unbound tDNAs (blue) were clustered based on their distance from the nearest Pol II gene TSS in 100 bp bins. Note that Pol III bound tDNAs cluster within 1 kb of the Pol II gene TSS (p-value<10−7), whereas the unbound tDNAs show no such clustering. A tDNA was classified as Pol III-bound if it had RPC32 and/or BRF1 occupancy. A promoter was defined as being ±2 kb from a Pol II gene TSS.
Figure 4
Figure 4
Chromatin features at Pol III-bound tDNAs in HeLa cells. (a–h) Pol III-bound genes were binned into three categories: Top 50 (blue), Middle 50 (red) and Bottom 50 (yellow) based on their Pol III levels, and class average maps were plotted for various factors and chromatin marks–. Class average plots of factors at tDNAs without Pol III (green) serve as negative controls. The x-axis is the distance from the Pol III TSS and the y-axis is the number of read counts at each nucleotide normalized to the number of regions in the class. The intersection fraction for each of these factor-bound regions with the Top 50 class is indicated in blue. (i) Example of a genomic locus showing a tDNA cluster with differential occupancy of Pol III, BRF1, TFIIIC63, H3K4me3 and Pol II. Note that the tRNATyr gene lacking Pol III machinery also lacks Pol II and H3K4me3. The percent mapping efficiency of each of the tRNA genes is indicated in parentheses (see Methods).
Figure 5
Figure 5
Chromatin marks and factors associated with Pol III-bound regions in Jurkat cells. (a) Example of a genomic locus showing a tDNA bound by Pol III (red) in Jurkat cells. Also shown are active acetylation (purple) and methylation (green) marks, H2A.Z (blue), Pol II (turquoise) and transcription factors (yellow). This putative enhancer is ~12 kb upstream of a Pol II gene TSS. Chromatin and factor ChIP-seq from others–. (b) Intersection analysis of Pol III bound regions (FDR<10%) with regions bound by ETS1 (FDR<1%; filtered for regions overlapping DNase I hypersensitivity in CD4+ cells41) and CBP (FDR<1%) in Jurkat cells. (c) Pol III-bound genes in HeLa (FDR<1%) were binned into those inside (red) or outside (blue) annotated Refseq promoters, and class average map of STAT1 was plotted; tDNAs without Pol III (green) serve as a negative control. The numbers denote the fraction of total Pol III genes occupied by STAT1 for loci either inside (red) or outside (blue) Refseq promoters. (d,e) Class average maps of ETS1 (red) and CBP (blue) at Pol III-bound genes inside (d) or outside (e) Refseq promoters in Jurkat cells. The red and blue dashed lines indicate approximate peaks of the corresponding factors. The intersection fractions of ETS1 (FDR<1%) and CBP (FDR<1%) regions with Pol III regions in Jurkat are indicated in red and blue respectively. (f) The graph represents the average HeLa RNA-seq read per kb score for each 1 kb region flanking tDNAs with error bars representing s.e.m. Note that transcripts are seen near tDNAs in Pol II promoters (from neighboring Pol II genes), but are not seen near tDNAs outside Pol II promoters.
Figure 6
Figure 6
Model depicting how chromatin features affect Pol III recruitment, at three different regions: promoters, enhancer-like promoters, and heterochromatin. (a) Chromatin features at an annotated Pol II gene promoter, where ~20% of active tDNAs with Pol III (red spheroid) reside, typically in a divergent orientation and about 300–400 bp from the peak of Pol II. This region contains transcription factors (TF, transcription factors and enhancer binding proteins, yellow spheres) and a large region of active chromatin, where nucleosomes (brown spheroids) have histone tails with positive/active modifications (green histone tails with ‘+’ balls). Active tDNAs are frequently found in pairs (shown) or clusters. At promoters, Pol II produces an RNA transcript from the annotated gene (purple thick DNA). (b) About 80% of active tDNAs are located distal to annotated Pol II promoters, and these regions have features both of Pol II promoters and enhancers. They contain active local chromatin, nearby Pol II, and TFs close to the Pol III gene. Although Pol II is present and there is evidence of Pol II initiation (H3K4me3), stable transcripts by Pol II are not detected (although it cannot be ruled out that unstable transcripts are produced). Outside of the local active region, we see facultative heterochromatin, represented by red histone tails and ‘−’ balls. (c) Inactive tDNAs lack active chromatin marks, TFs, or Pol II, and instead are associated with repressive chromatin marks (red histone tails and ‘−’ balls), suggesting a more tightly packed chromatin environment that is inaccessible to Pol III machinery.

References

    1. White RJ. RNA Polymerase III Transcription. Springer-Verlag; New York, NY: 1998.
    1. Dieci G, Fiorino G, Castelnuovo M, Teichmann M, Pagano A. The expanding RNA polymerase III transcriptome. Trends Genet. 2007;23:614–22. - PubMed
    1. White RJ. RNA polymerases I and III, non-coding RNAs and cancer. Trends Genet. 2008;24:622–9. - PubMed
    1. Marshall L, White RJ. Non-coding RNA production by RNA polymerase III is implicated in cancer. Nat Rev Cancer. 2008;8:911–4. - PubMed
    1. Willis IM. RNA polymerase III. Genes, factors and transcriptional specificity. Eur J Biochem. 1993;212:1–11. - PubMed

Publication types

Associated data