

Genome-wide meta-analyses identify multiple loci associated with smoking behavior
- PMID: 20418890
- PMCID: PMC2914600
- DOI: 10.1038/ng.571
Genome-wide meta-analyses identify multiple loci associated with smoking behavior
Abstract
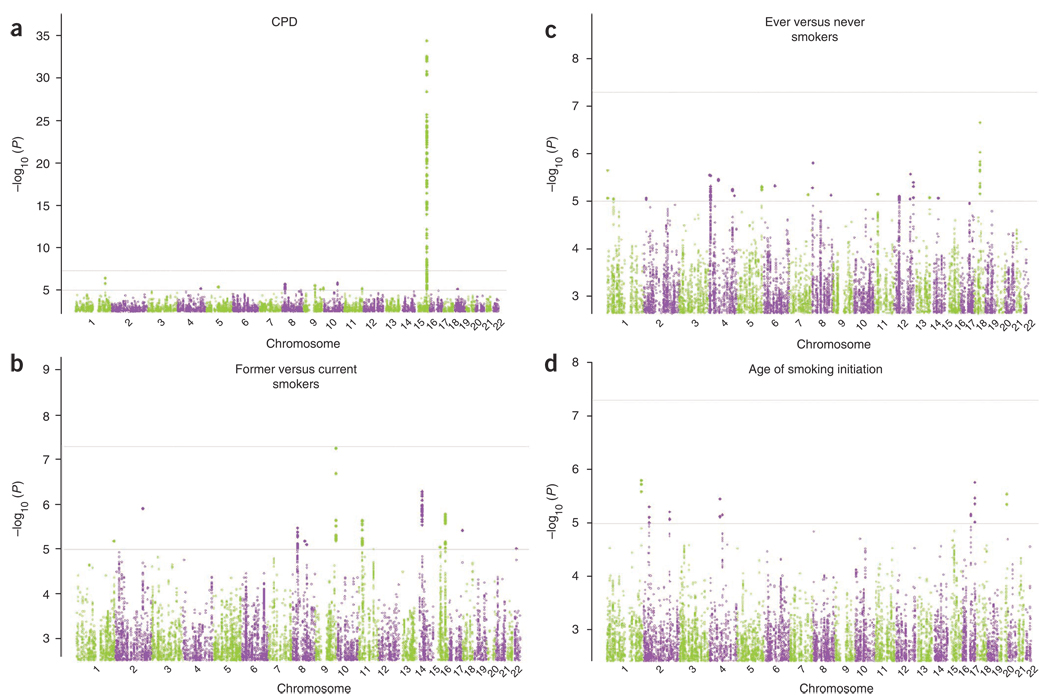
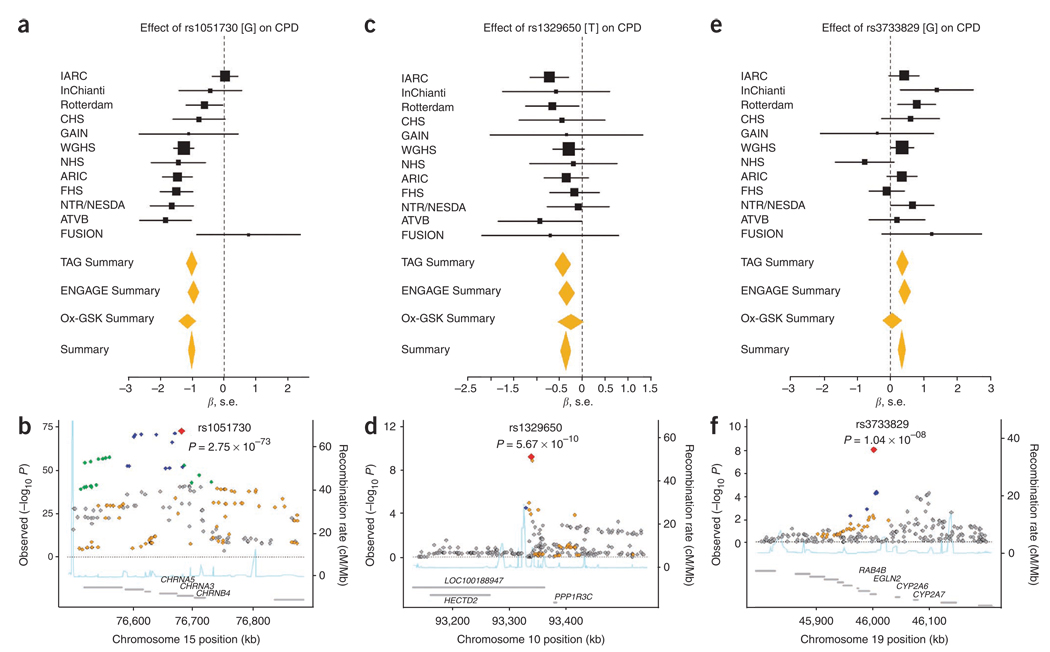
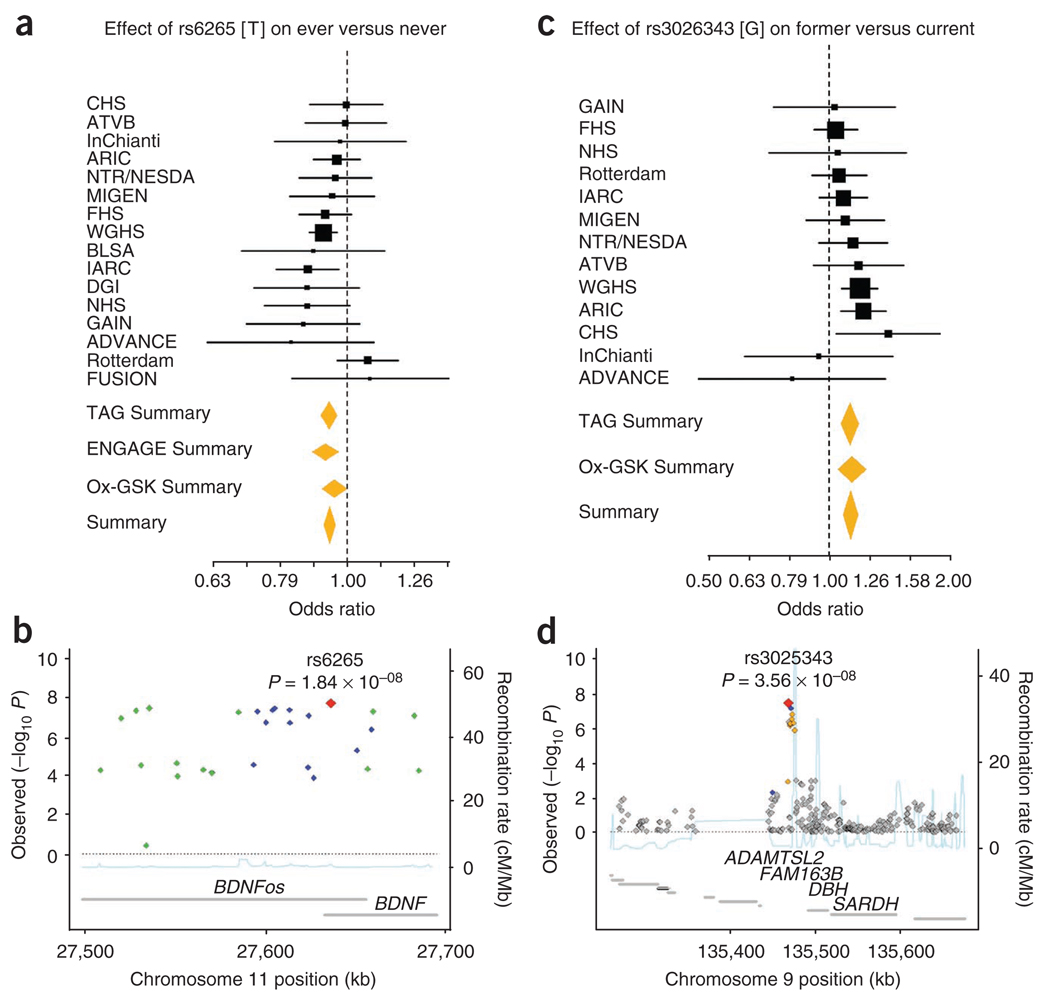
Consistent but indirect evidence has implicated genetic factors in smoking behavior. We report meta-analyses of several smoking phenotypes within cohorts of the Tobacco and Genetics Consortium (n = 74,053). We also partnered with the European Network of Genetic and Genomic Epidemiology (ENGAGE) and Oxford-GlaxoSmithKline (Ox-GSK) consortia to follow up the 15 most significant regions (n > 140,000). We identified three loci associated with number of cigarettes smoked per day. The strongest association was a synonymous 15q25 SNP in the nicotinic receptor gene CHRNA3 (rs1051730[A], beta = 1.03, standard error (s.e.) = 0.053, P = 2.8 x 10(-73)). Two 10q25 SNPs (rs1329650[G], beta = 0.367, s.e. = 0.059, P = 5.7 x 10(-10); and rs1028936[A], beta = 0.446, s.e. = 0.074, P = 1.3 x 10(-9)) and one 9q13 SNP in EGLN2 (rs3733829[G], beta = 0.333, s.e. = 0.058, P = 1.0 x 10(-8)) also exceeded genome-wide significance for cigarettes per day. For smoking initiation, eight SNPs exceeded genome-wide significance, with the strongest association at a nonsynonymous SNP in BDNF on chromosome 11 (rs6265[C], odds ratio (OR) = 1.06, 95% confidence interval (Cl) 1.04-1.08, P = 1.8 x 10(-8)). One SNP located near DBH on chromosome 9 (rs3025343[G], OR = 1.12, 95% Cl 1.08-1.18, P = 3.6 x 10(-8)) was significantly associated with smoking cessation.
Figures
Comment in
-
Chipping away at the genetics of smoking behavior.Nat Genet. 2010 May;42(5):366-8. doi: 10.1038/ng0510-366. Nat Genet. 2010. PMID: 20428092 Free PMC article.
-
Connecting the dots, genome-wide association studies in substance use.Mol Psychiatry. 2016 Jun;21(6):733-5. doi: 10.1038/mp.2016.14. Epub 2016 Mar 15. Mol Psychiatry. 2016. PMID: 26976040 No abstract available.
References
-
- Rose RJ, Broms U, Korhonen T, Dick DM, Kaprio J. Genetics of Smoking Behavior. In: Kim Y-K, editor. Handbook of Behavior Genetics. New York: Springer; 2009. pp. 411–432.
-
- Li MD. Identifying susceptibility loci for nicotine dependence: 2008 update based on recent genome-wide linkage analyses. Hum. Genet. 2008;123:119–131. - PubMed
-
- Fiore MC, Smith SS, Jorenby DE, Baker TB. The effectiveness of the nicotine patch for smoking cessation. A meta-analysis. J. Am. Med. Assoc. 1994;271:1940–1947. - PubMed
Publication types
MeSH terms
Substances
Grants and funding
LinkOut - more resources
Full Text Sources
Molecular Biology Databases
Miscellaneous
