

Real-time epidemic monitoring and forecasting of H1N1-2009 using influenza-like illness from general practice and family doctor clinics in Singapore
- PMID: 20418945
- PMCID: PMC2854682
- DOI: 10.1371/journal.pone.0010036
Real-time epidemic monitoring and forecasting of H1N1-2009 using influenza-like illness from general practice and family doctor clinics in Singapore
Abstract
Background: Reporting of influenza-like illness (ILI) from general practice/family doctor (GPFD) clinics is an accurate indicator of real-time epidemic activity and requires little effort to set up, making it suitable for developing countries currently experiencing the influenza A (H1N1-2009) pandemic or preparing for subsequent epidemic waves.
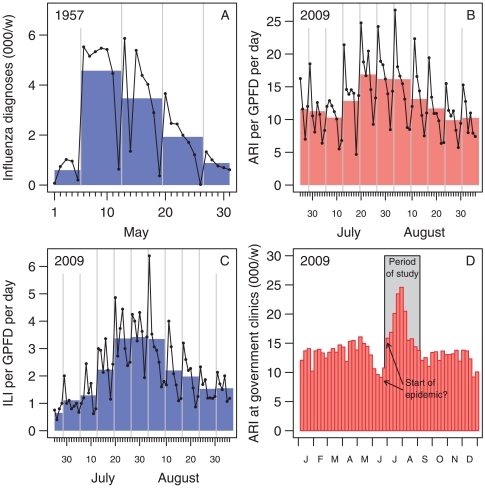
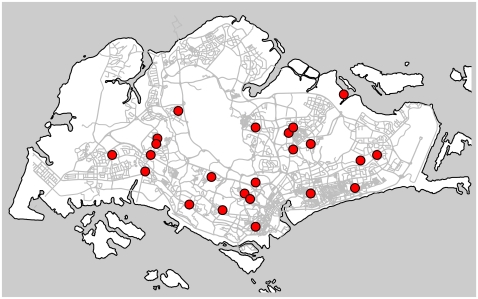
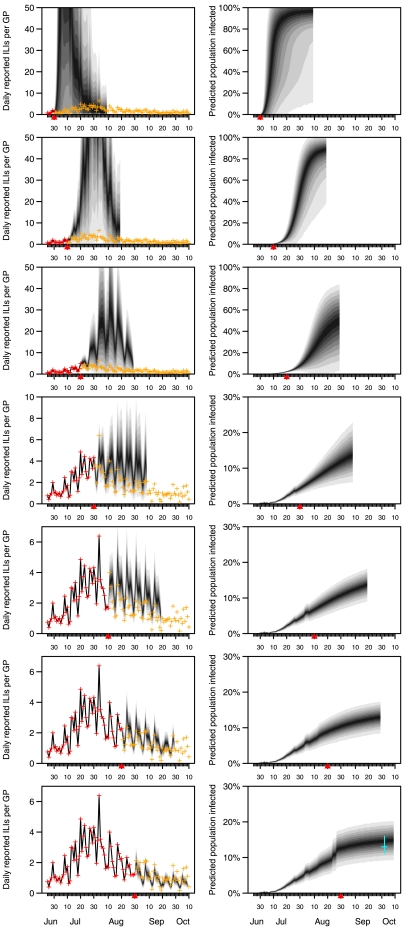
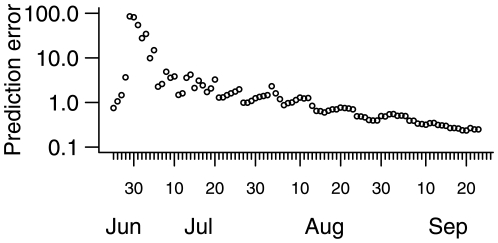
Methodology/principal findings: We established a network of GPFDs in Singapore. Participating GPFDs submitted returns via facsimile or e-mail on their work days using a simple, standard data collection format, capturing: gender; year of birth; "ethnicity"; residential status; body temperature (degrees C); and treatment (antiviral or not); for all cases with a clinical diagnosis of an acute respiratory illness (ARI). The operational definition of ILI in this study was an ARI with fever of 37.8 degrees C or more. The data were processed daily by the study co-ordinator and fed into a stochastic model of disease dynamics, which was refitted daily using particle filtering, with data and forecasts uploaded to a website which could be publicly accessed. Twenty-three GPFD clinics agreed to participate. Data collection started on 2009-06-26 and lasted for the duration of the epidemic. The epidemic appeared to have peaked around 2009-08-03 and the ILI rates had returned to baseline levels by the time of writing.
Conclusions/significance: This real-time surveillance system is able to show the progress of an epidemic and indicates when the peak is reached. The resulting information can be used to form forecasts, including how soon the epidemic wave will end and when a second wave will appear if at all.
Conflict of interest statement
Figures
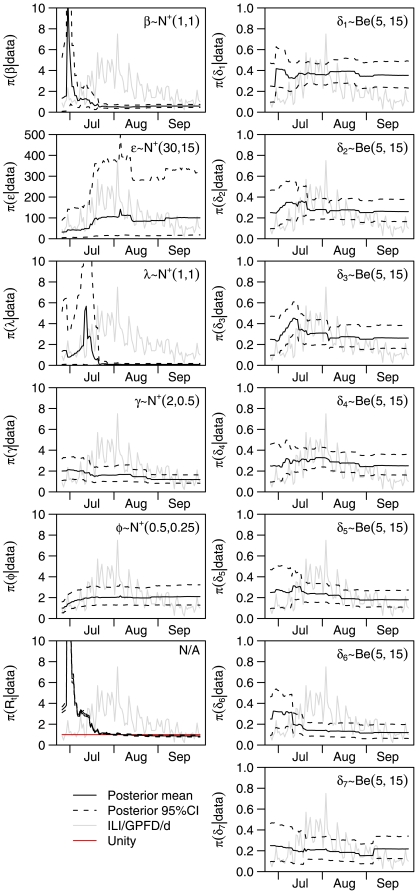
 ; the posterior crosses the line of unity around the day of the peak. Prior distributions for the parameters (
 is not a parameter) are indicated on the appropriate panels, using the notation
  for the beta distribution and
  for the modified normal distribution such that if
  then
then  and
and  . The prior distributions taken for the states were
  ,
,  and
and  (a Dirac delta prior), where
  is similar to
  except that its support is the integers, and its mass function at
  is obtained by integrating the density for
  from
from  to
to  .
.References
-
- WHO. Influenza-like illness in the United States and Mexico. World Wide Web electronic publication. 2010. URL http://www.who.int/csr/don/2009_04_24/en/index.html.
-
- WHO. Pandemic (h1n1) 2009 - update 59. World Wide Web electronic publication. 2010. URL http://www.who.int/csr/don/2009_07_27/en/index.html.
-
- Ministry of Health (Singapore) First confirmed case of influenza A (H1N1-2009) in Singapore. World Wide Web electronic publication. 2010. URL http://www.moh.gov.sg/mohcorp/pressreleases.aspx?id=21914.
-
- Ministry of Health (Singapore) 26 confirmed new cases of influenza A (H1N1-2009). World Wide Web electronic publication. 2010. URL http://www.moh.gov.sg/mohcorp/pressreleases.aspx?id=22202.
Publication types
MeSH terms
LinkOut - more resources
Full Text Sources
Medical
