. 2010 Apr 14;5(4):e10176.
doi: 10.1371/journal.pone.0010176.

Specific recognition of influenza A/H1N1/2009 antibodies in human serum: a simple virus-free ELISA method

Affiliations

Specific recognition of influenza A/H1N1/2009 antibodies in human serum: a simple virus-free ELISA method

Mario M Alvarez et al. PLoS One. .

Abstract

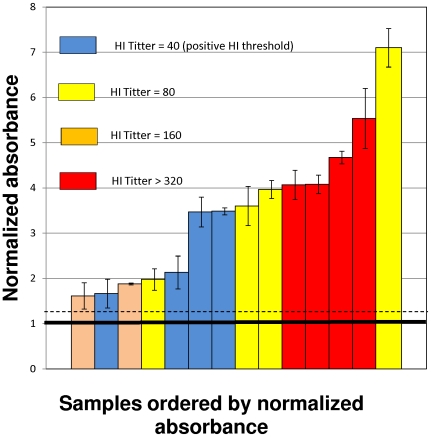
Background: Although it has been estimated that pandemic Influenza A H1N1/2009 has infected millions of people from April to October 2009, a more precise figure requires a worldwide large-scale diagnosis of the presence of Influenza A/H1N1/2009 antibodies within the population. Assays typically used to estimate antibody titers (hemagglutination inhibition and microneutralization) would require the use of the virus, which would seriously limit broad implementation.

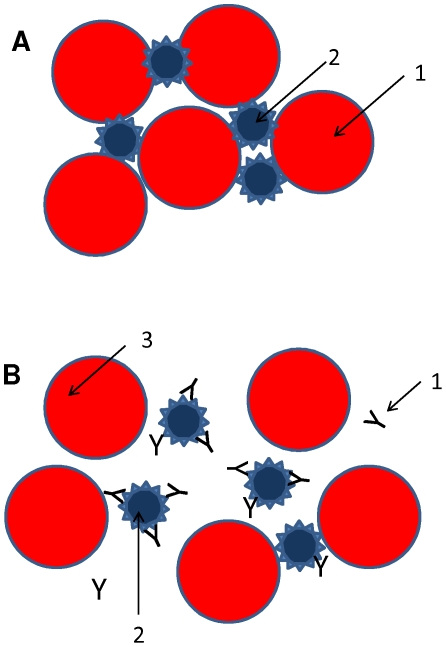
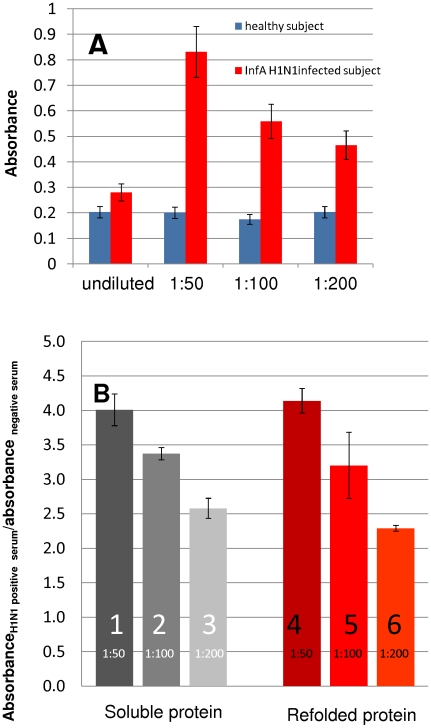
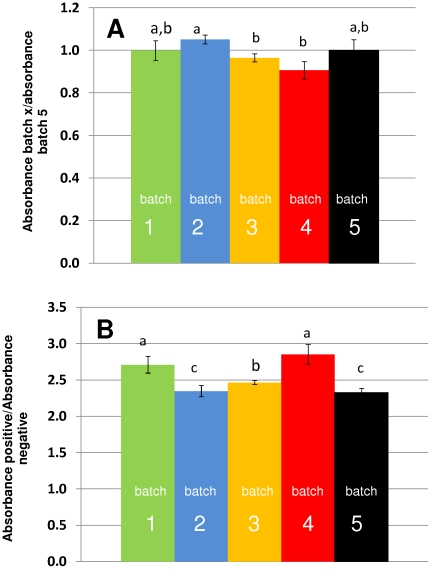
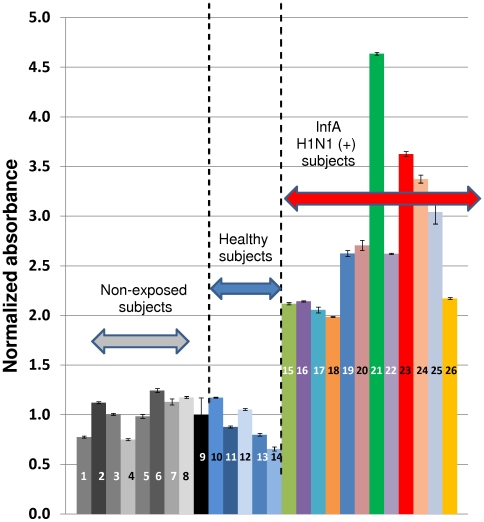
Methodology/principal findings: An ELISA method to evaluate the presence and relative concentration of specific Influenza A/H1N1/2009 antibodies in human serum samples is presented. The method is based on the use of a histidine-tagged recombinant fragment of the globular region of the hemagglutinin (HA) of the Influenza A H1N1/2009 virus expressed in E. coli.

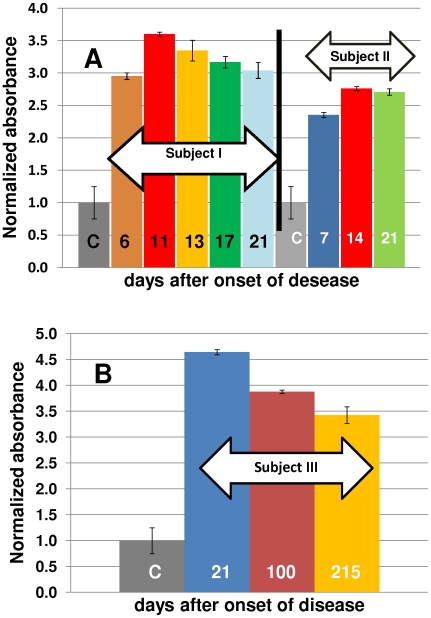
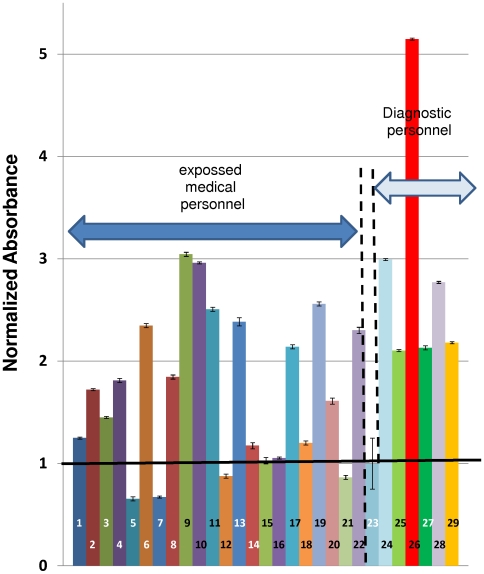
Conclusions/significance: The ELISA method consistently discerns between Inf A H1N1 infected and non-infected subjects, particularly after the third week of infection/exposure. Since it does not require the use of viral particles, it can be easily and quickly implemented in any basic laboratory. In addition, in a scenario of insufficient vaccine availability, the use of this ELISA could be useful to determine if a person has some level of specific antibodies against the virus and presumably at least partial protection.


Conflict of interest statement

Competing Interests: The authors have declared that no competing interests exist.

Figures

Figure 1
Figure 1. Hemagglutination inhibition assay.
(A) Schematic representation of hemagglutination using Influenza viral particles. In the absence of agglutinationon inhibitors, the hemagglutinin from viral capsids (1) agglutinates chicken, turkey or human erythrocytes(2). (B) Schematic representation of hemagglutination inhibition. In the presence of neutralizing antibodies (1) that specifically recognize the hemagglutinin from a influenza virus (2), the process of hemagglutination is inhibited proportionally to the concentration and binding affinity of the neutralizing antibodies.
Figure 2
Figure 2. Strategy used to express protein HA50–274-H1N1 in E. coli.
The DNA region specifically encoding for the HA amino-acid sequence between residues 50 and 274 was preceded by a promoter region and added in the N-terminus with a sequence encoding for a histydine tag.
Figure 3
Figure 3. ELISA method designed to evaluate the relative concentration of specific antibodies (Y) anti-influenza A/H1N1/2009 virus in human serum and plasma.
(A) Adsorption of anti-hystidine antibodies to the assay surface on 96-wells micro-assay plates and blockage of the remaining available surface with a commercial blocking solution. (B) Addition of the recombinant protein HA50–274-H1N1 (semi-circles). (C) Addition of serum samples potentially containing specific antibodies (Y) against the Influenza A H1N1/2009 virus. The left hand panel illustrates a scenario with a higher concentration of specific influenza antibodies. (D) Addition of a peroxidated anti-IgG human antibody (Y) to specifically bind the retained serum antibodies. (E) The addition of peroxidase substrate (S) enables the enzymatic reaction (S→P) with a proportional development of color.
Figure 4
Figure 4. Serum from patients infected with Influenza A H1N1/2009 specifically recognize recombinant protein HA50–274-H1N1.
(A) Results corresponding to undiluted serum samples and three different dilutions of serum in phosphate buffer saline solution (PBS) are presented (1∶50, 1∶100 and 1∶200). Blue bars correspond to absorbance signal from samples of healthy subjects. Red bars correspond to absorbance signal from samples of patients diagnosed as positive for Influenza A H1N1 taken three weeks after infection. Error bars were calculated based on the maximum percentage of variance (100*Average signal/standard deviation). (B) The ratio of the absorbance signal exhibited by a sample from a positive patient/absorbance signal of a sample from a healthy volunteer is presented. Results corresponding to three different serum dilutions (1∶50, 1∶100 and 1∶200) and two types of protein are presented (protein obtained directly in soluble form (columns identified as 1,2 and 3); and protein obtained after dissolution and refolding from inclusion bodies (columns identified as 4,5 and 6). Three replicates of each observation were considered. Error bars were calculated based on standard deviation.
Figure 5
Figure 5. Indirect evaluation of proper refolding.
(A) Biorecognition of antibodies from a positive patient observed for different production batches of protein HA50–274-H1N1. (B) Specific biorecognition ratio (ratio of biorecognition of antibodies from a positive patient serum and a negative subject serum) observed at different refolding batches derived from the same E. coli culture experiment. Variation among batches consisted in minor variations in the dissolution and refolding protocol used.
Figure 6
Figure 6. Evolution of the normalized absorbance signal of serum samples from patients diagnosed as positive to Influenza A/H1N1/2009.
(A) Samples from two distinct patients were taken during the first three weeks after the onset of disease. Specific antibody titers more than double their basal value after day 7. (B) Samples from a patient taken at day 21, 100, and 215 after the onset of disease reveal that antibody titters remained high for at least seven months. Patients were diagnosed using RT-PCR protocols (WHO, 2009).
Figure 7
Figure 7. Serum from patients infected with Influenza A H1N1/2009 specifically recognize protein HA50–274-H1N1.
Bars 1–8 (gray) correspond to absorbance signals from non-exposed subjects (samples taken from March to May 2008). Bar 9 (black) shows the average absorbance value of samples 1 to 8. Bars 10 to 14 (blue colors) correspond to absorbance signals from Inf A/H1N1 negative subjects. Bars 15–26 (different colors) correspond to absorbance signals from samples of Inf A H1N1 positive subjects (diagnosed two or three weeks before by RT-PCR). All signals were normalized with respect to the average absorbance signal observed in samples from non-exposed volunteers. Error bars form samples 1–8 and 10–26 represent one standard deviation based on at least three replicates on the assay in the same micro-plate experiment. Error bars form sample 9 represent one standard deviation based on all assays performed to samples from non-exposed volunteers.
Figure 8
Figure 8. Validation of sensitivity against an HI assay.
Normalized absorbance values for fourteen samples with positive anti H1N1/2009 titters based on an HI assay (samples that inhibited hemagglutination of turkey erythrocytes by the Ca/2009/H1N1 influenza virus strain at dilutions equal or higher to 1∶40). Colors indicate HI titter: HI titter = 40 (in blue); HI titter = 80 (in yellow); HI titter = 160 (in orange); HI titter>320 (in red). The proposed positive threshold for the ELISA method is indicated with a solid line (value = 1). One standard deviation is indicated with a dashed line (value = 1.25).
Figure 9
Figure 9. Reproducibility of the ELISA method for specific evaluation of anti Influenza A/H1N1/2009 antibodies in serum samples.
Bars present the normalized absorbance value for samples of: three independent replicates of the assay on a sample of a non-exposed volunteer (bar 1); the average absorbance signal from eight different non-exposed volunteers (bar 2); three independent replicates of assays on samples taken two weeks after positive diagnostic on two different Influenza A/H1N1/2009 infected volunteers (bars 3 and 4); three independent replicates of assays on a sample taken three weeks after positive diagnostic on a Influenza A/H1N1/2009 infected volunteer (bar 5); three independent replicates of assays on a sample taken four weeks after positive diagnostic on a Influenza A/H1N1/2009 infected volunteer (bar 6).
Figure 10
Figure 10. Normalized absorbance signals of serum samples from health care and diagnostic personnel in high exposure risk to the Influenza A/H1N1/2009 virus.
Bars 1–22 present signals corresponding to asymptomatic health care workers. Bars 24–29 present signals corresponding to samples from H1N1 molecular diagnostic personnel. Bar 23 (negative reference) illustrates the average and standard deviation of eight samples from non-exposed subjects.

References

    1. Thompson WW, Shay DK, Weintraub E, Brammer L, Cox N, et al. Mortality Associated With Influenza and Respiratory Syncytial Virus in the United States. JAMA. 2003;289 (2):179–1186. - PubMed
    1. Keech M, Beardsworth P. The impact of influenza on working days lost: A review of the literature. PharmacoEconomics. 2009;26 (11):911–924. - PubMed
    1. Sadique MdZ, Adams EJ, Edmunds WJ. Estimating the costs of school closure for mitigating an influenza pandemic. BMC Public Health. 2008;8(135) - PMC - PubMed
    1. Molinari N-AM, Ortega-Sanchez IR, Messonnier ML, Thompson WW, Wortley PM, et al. The annual impact of seasonal influenza in the US: Measuring disease burden and costs. Vaccine. 2007;25 (27):5086–5096. - PubMed
    1. Carrat F, Flahault A. Influenza vaccine: The challenge of antigenic drift. Vaccine. 2007;25 (39–40):6852–6862. - PubMed

Publication types

MeSH terms

Substances