. 2010 Apr 15;6(4):e1000740.
doi: 10.1371/journal.pcbi.1000740.

Predicting odor pleasantness with an electronic nose

Affiliations

Predicting odor pleasantness with an electronic nose

Rafi Haddad et al. PLoS Comput Biol. .

Abstract

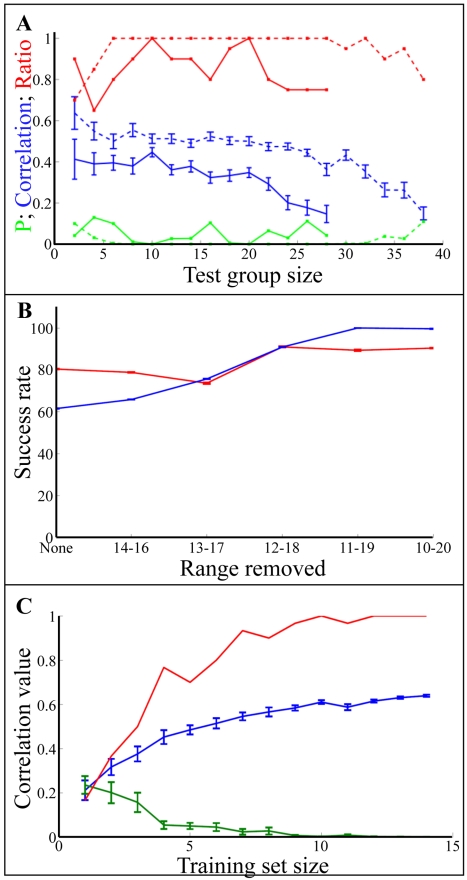
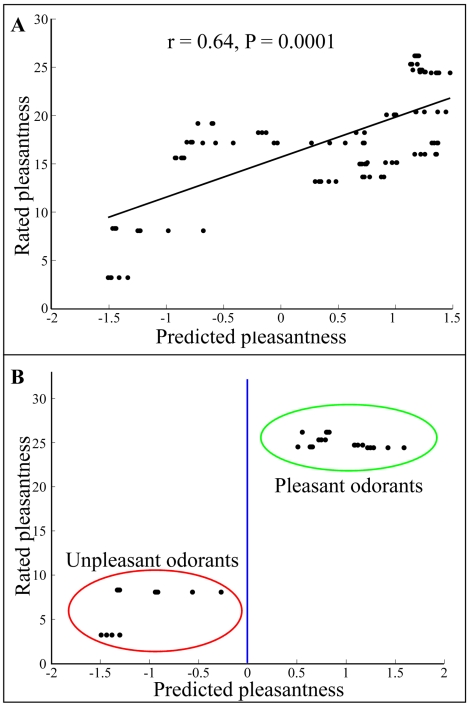
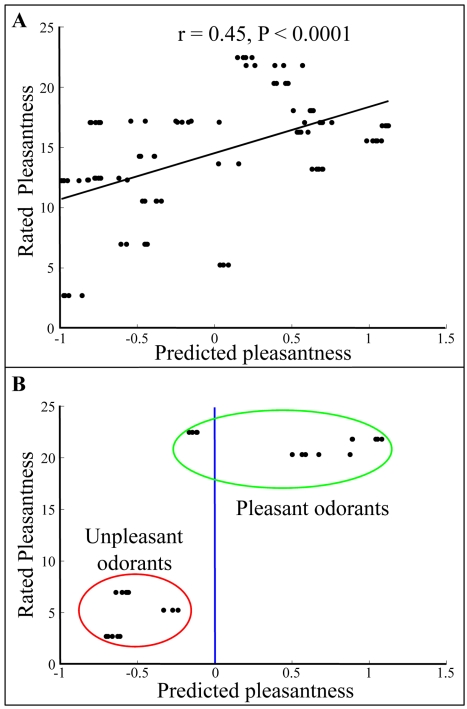
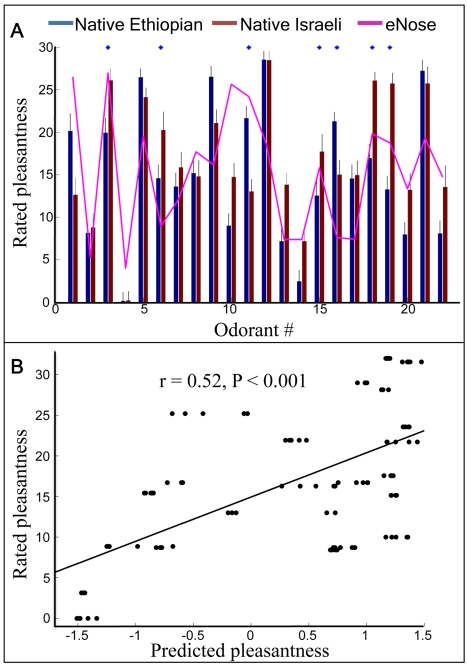
A primary goal for artificial nose (eNose) technology is to report perceptual qualities of novel odors. Currently, however, eNoses primarily detect and discriminate between odorants they previously "learned". We tuned an eNose to human odor pleasantness estimates. We then used the eNose to predict the pleasantness of novel odorants, and tested these predictions in naïve subjects who had not participated in the tuning procedure. We found that our apparatus generated odorant pleasantness ratings with above 80% similarity to average human ratings, and with above 90% accuracy at discriminating between categorically pleasant or unpleasant odorants. Similar results were obtained in two cultures, native Israeli and native Ethiopian, without retuning of the apparatus. These findings suggest that unlike in vision and audition, in olfaction there is a systematic predictable link between stimulus structure and stimulus pleasantness. This goes in contrast to the popular notion that odorant pleasantness is completely subjective, and may provide a new method for odor screening and environmental monitoring, as well as a critical building block for digital transmission of smell.


Conflict of interest statement

The Weizmann Institute has filed a patent on “predicting odorant pleasantness with an electronic nose” as described in this manuscript.

Figures

Figure 1
Figure 1. Predicting odor pleasantness with an eNose.
A. Blue line: correlation values when using different numbers of odorants as test groups and the standard error. The total number of odorants used in this analysis was 76. The numbers in the abscissa are the number of odorants used as a test set. For each point in the graph, we randomly selected odorants and removed them from the training set. We then trained the eNose using the remaining odorants. We repeated this process 20 times for each group size. The red line marks the percent of times the algorithm obtained P<0.05. The green line shows the average P value. Dashed lines show the same analysis but with an initial training set of 98 odorants (the 76 training set plus the 22 essential oils, see text). B. The classification success rate as a function of the odors removed from the test set. Odor rates ranged from 0 to 30. We tested the classification rate when we did not remove any odors (None) and when removed an increasing number of odors. For example, 14–16 represent a test in which we did not consider odors with pleasantness ratings ranging from 14 to 16 (e.g. 1 point below and 1 point above the average ratings). Blue line: the essential oils experiment. Red line the second 21 odorants experiment. C. Power analysis. Blue: The prediction rate (correlation value) versus the number of odorants used in the training set. Red: the ratio of the number of times the P value was not significant (P>0.05). Green: The mean P value.
Figure 2
Figure 2. Predicting pleasantness of novel odorants: Essential oils.
A. The correlation between the eNose pleasantness prediction values of 22 odorant mixtures (essential oils) and the values obtained from human participants. Each dot represents an eNose measurement (many dots overlay) B. The result of the classification algorithm when removing all odors with medium pleasantness ratings (below and above 1/3 and 2/3 of the pleasantness scale respectively).
Figure 3
Figure 3. Predicting pleasantness of novel odorants: Neat odorants.
A. The correlation between the eNose pleasantness prediction values of 21 odorants and the values obtained from human participants. Each dot represents an eNose measurement (many dots overlay) B. The result of the classification algorithm when removing all odorants with medium pleasantness ratings (below and above 1/3 and 2/3 of the pleasantness scale respectively).
Figure 4
Figure 4. Raw eNose signal amplitude did not reflect pleasantness.
Four typical odorant eNose signals of both the QMB sensor module (upper panels) and MOX sensor modules (lower panels). Each line shows the dynamic response of one sensor. Note that both pleasant and unpleasant odorants generated both strong and weak responses. A and B. An example of two very pleasant odorants. C and D An example of two very unpleasant odorants.
Figure 5
Figure 5. Cross-cultural validation.
A. Odorant-specific pleasantness ratings for native Ethiopians (blue), native Israelis (brown), and eNose (pink). The blue stars on the upper x axis denote the 7 odorants where native Ethiopians and native Israelis significantly differed in their pleasantness ratings. Note that for odors #6 #18 and #19 the pink line (eNose) is in fact closer to the native Ethiopians than to the native Israelis even though the eNose was tuned on a separate group of native Israelis. B. The correlation between the eNose pleasantness prediction values of 22 odorant mixtures (essential oils) and the values obtained from native Ethiopians. Each dot represents an eNose measurement (many dots overlay). Comparing Figure 2a to 5b reveals that native Israeli participants rated more at the middle of the VAS scale and native Ethiopians rated more at the scale extremes.

References

    1. Dravnieks A. Approaches to objective olfactometry. In: Tanyolac N, editor. Theories of odors and odor measurement. Istanbul: Robert Coll Res. Center; 1968. pp. 371–408.
    1. Persaud K, Dodd G. Analysis of discrimination mechanisms in the mammalian olfactory system using a model nose. Nature. 1982;299:352–355. - PubMed
    1. Gardner JW, Bartlett PN. Electronic noses. Principles and applications. Measurement Science and Technology. 2000;11:1087.
    1. Pearce TC, Schiffman S, Nagle HT, Gardner JW, editors. Handbook of machine. Olfaction: Wiley; 2003.
    1. Albert KJ, Lewis NS, Schauer CL, Sotzing GA, Stitzel SE, et al. Cross-reactive chemical sensor arrays. Chemical Reviews. 2000;100:2595–2626. - PubMed

Publication types