. 2009 Jul 31;5(9):2544-2564.
doi: 10.1021/ct900234u.

The AGBNP2 Implicit Solvation Model

Affiliations

The AGBNP2 Implicit Solvation Model

Emilio Gallicchio et al. J Chem Theory Comput. .

Abstract

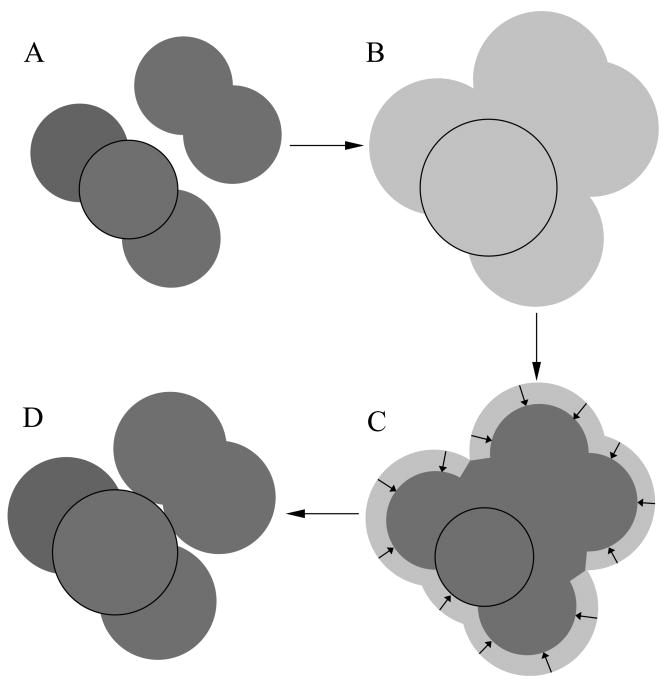
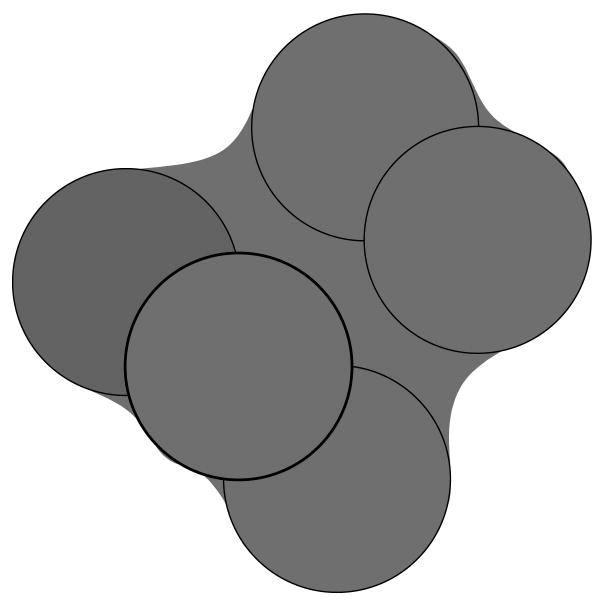
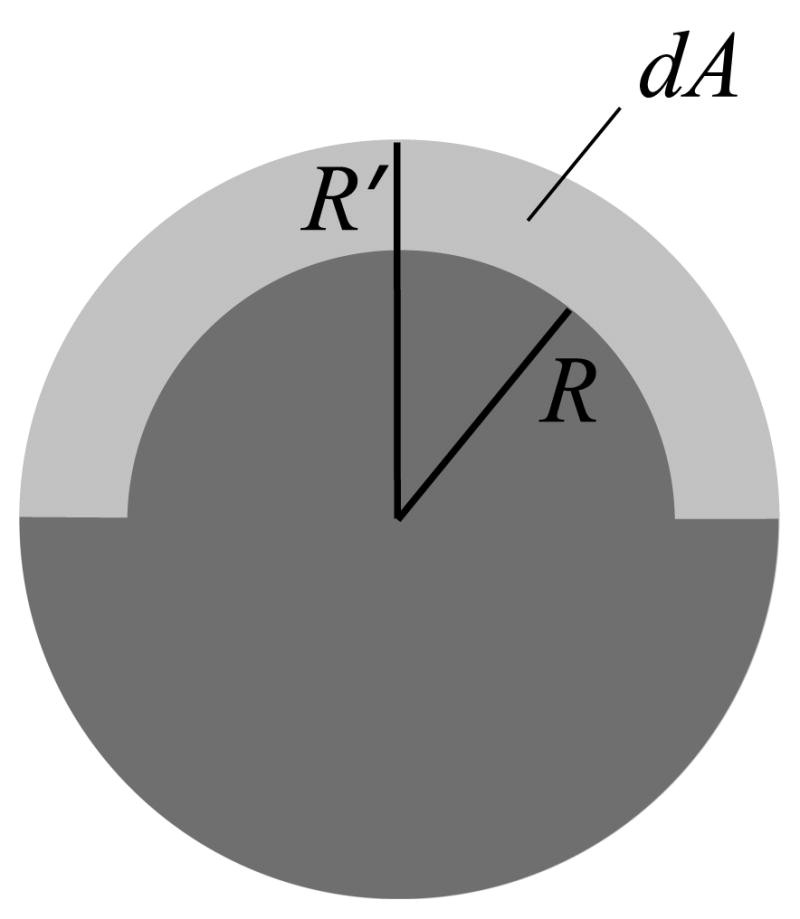
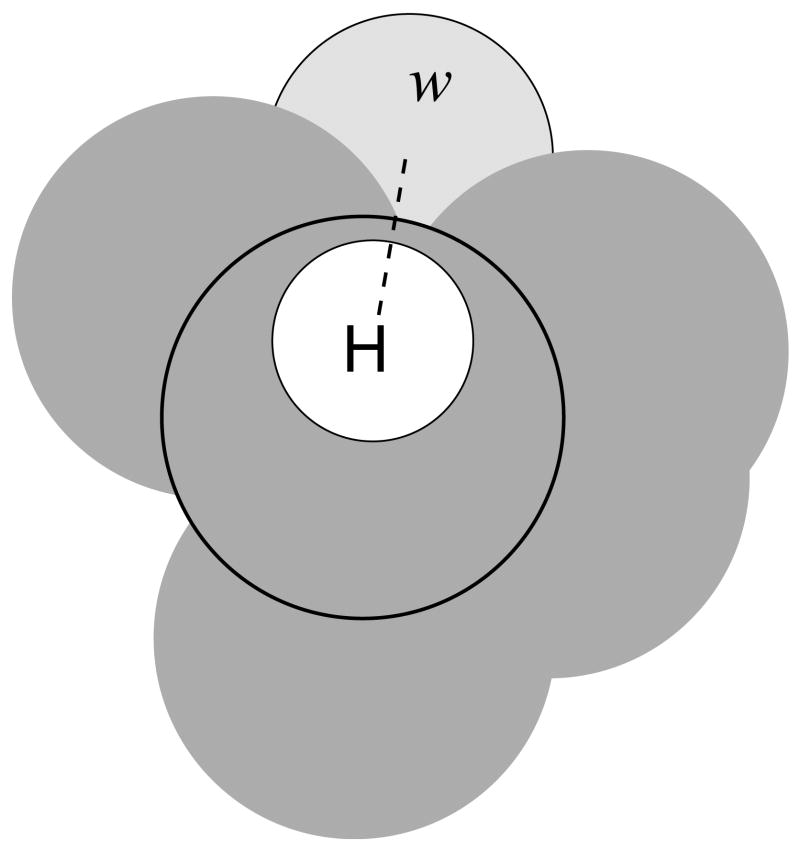
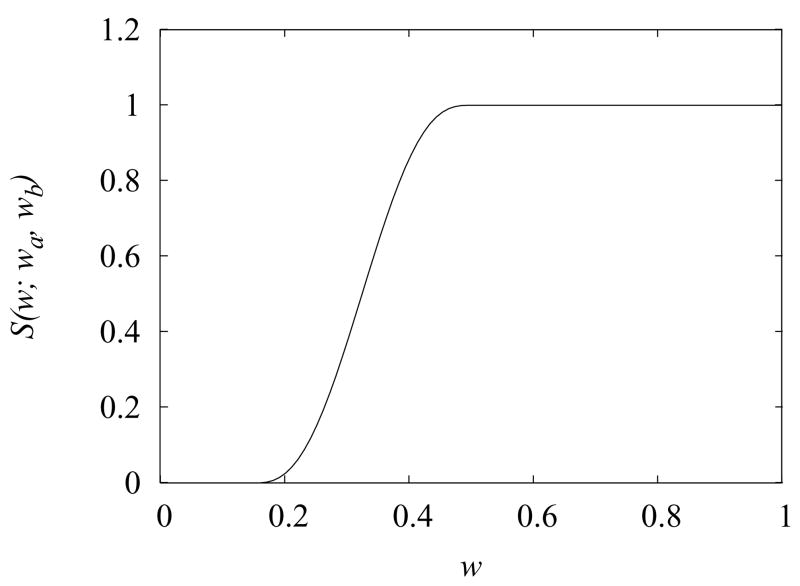
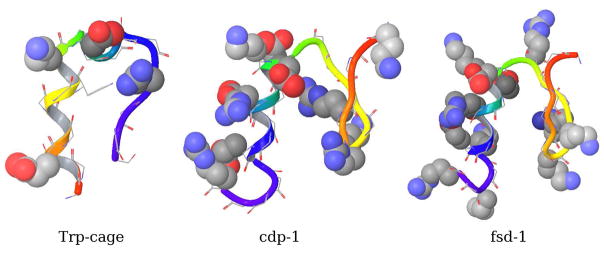
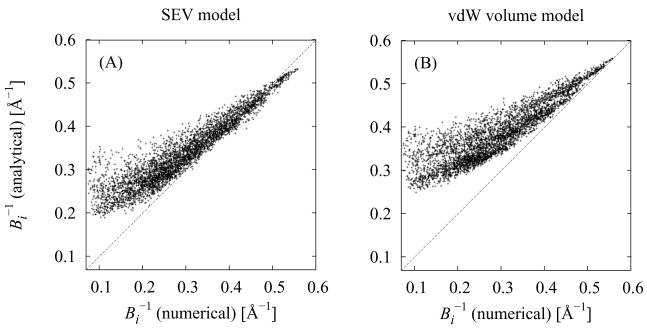
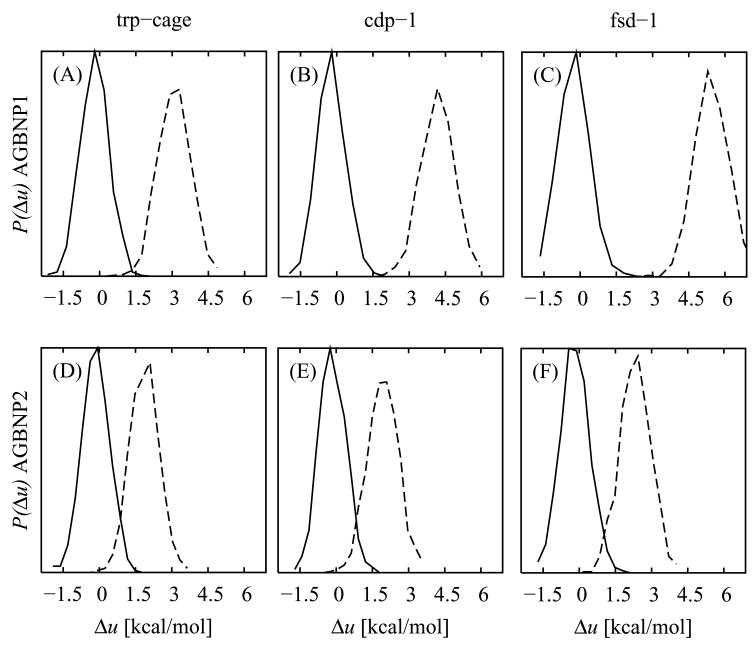
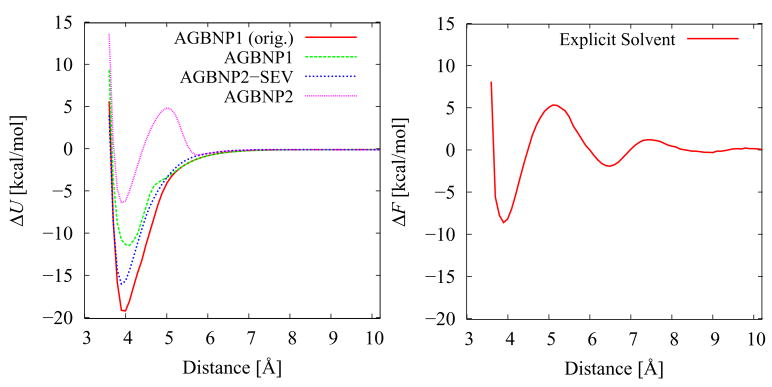
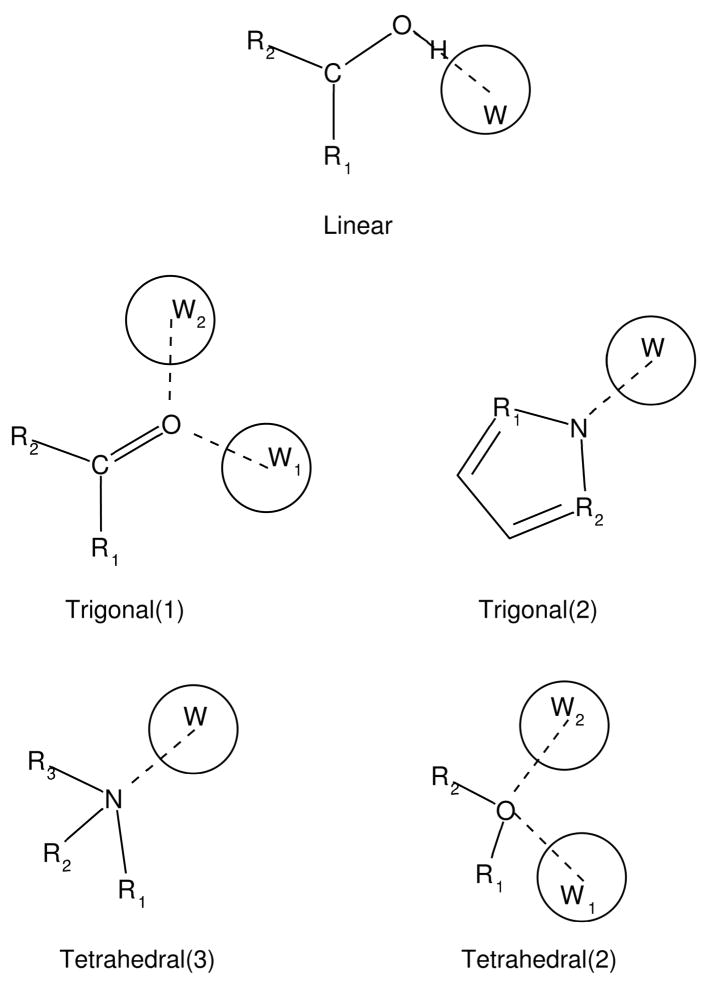
The AGBNP2 implicit solvent model, an evolution of the Analytical Generalized Born plus Non-Polar (AGBNP) model we have previously reported, is presented with the aim of modeling hydration effects beyond those described by conventional continuum dielectric representations. A new empirical hydration free energy component based on a procedure to locate and score hydration sites on the solute surface is introduced to model first solvation shell effects, such as hydrogen bonding, which are poorly described by continuum dielectric models. This new component is added to the Generalized Born and non-polar AGBNP terms. Also newly introduced is an analytical Solvent Excluded Volume (SEV) model which improves the solute volume description by reducing the effect of spurious high-dielectric interstitial spaces present in conventional van der Waals representations. The AGBNP2 model is parametrized and tested with respect to experimental hydration free energies of small molecules and the results of explicit solvent simulations. Modeling the granularity of water is one of the main design principles employed for the the first shell solvation function and the SEV model, by requiring that water locations have a minimum available volume based on the size of a water molecule. It is shown that the new volumetric model produces Born radii and surface areas in good agreement with accurate numerical evaluations of these quantities. The results of molecular dynamics simulations of a series of mini-proteins show that the new model produces conformational ensembles in substantially better agreement with reference explicit solvent ensembles than the original AGBNP model with respect to both structural and energetics measures.


Figures

Figure 1
Figure 1
Schematic diagram illustrating the ideas underpinning the model for the solvent excluded volume descreening. Circles represent atoms of two idealized solutes placed in proximity of each other. The van der Waals description of the molecular volume (panel A) leaves high dielectric interstitial spaces that are too small to fit water molecules. The adoption of enlarged van der Waals radii (B) removes the interstitial spaces but incorrectly excludes solvent from the surface of solvent exposed atoms. The solvent volume subtended by the solvent-exposed surface area is subtracted from the enlarged volume of each atom (C) such that larger atomic descreening volumes are assigned to buried atoms (circled) than exposed atoms (D), leading to the reduction of interstitial spaces while not overly excluding solvent from the surface of solvent exposed atoms.
Figure 2
Figure 2
Illustration of the relationship between the van der Waals volume and the solvent excluded volume enclosed by the molecular surface.
Figure 3
Figure 3
Graphical construction showing the volume subtracted from the atomic self-volume to obtain the surface-area corrected atomic self-volume. R is the van der Waals radius of the atom, R′ = R + ΔR is the enlarged atomic radius. dA is the volume of the region (light gray) subtended by the solvent-exposed surface area in between the enlarged and van der Waals atomic spheres.
Figure 4
Figure 4
Schematic diagram for the placement of the water sphere (w, light gray) corresponding to the hydrogen bonding position relative to the a polar hydrogen (white sphere) of the solute (dark gray). The dashed line traces the direction of the hydrogen-parent heavy atom (circled) bond along which the water sphere is placed. The magnitude of hydrogen bonding correction grows as a function of the volume (light gray) of the water site sphere not occupied by solute atoms.
Figure 5
Figure 5
The switching function S(w; wa, wb) from Eqs. (38) and (9) with wa = 0.15 and wb = 0.5.
Figure 6
Figure 6
Graphical representations of the NMR structures of the three miniproteins investigated in this work: trp-cage (pdb id: 1RIJ), cdp-1 (pdb id: 1PSV), and fsd-1 (pdb id: 1FSD). In each case the first deposited NMR model is shown. Backbone ribbon is colored from N-terminal (red) to the C-terminal (blue). Charged sidechains are shown in space-filling representation.
Figure 7
Figure 7
Comparisons between numerical and analytical molecular surface areas of the heavy atoms of the crystal structures (1ctf and 1lz1, respectively) of the C-terminal domain of the ribosomal protein L7/L12 (74 aa) and human lysozyme (130 aa), and of four conformations each of the trp-cage, cdp-1, and fsd-1 miniproteins extracted from the corresponding explicit solvent MD trajectories of the same protein conformations as in Fig. 8. (A) Analytical molecular surface areas computed using the present model, and (B), for comparison, analytical surface areas computed using the original model from reference .
Figure 8
Figure 8
Comparisons between numerical and analytical inverse Born radii for the heavy atoms of the same protein conformations as in Fig. 7 (A) Analytical Born radii computed using the present SEV model. (B) Analytical Born radii computed using the van der Waals volume model (reference 42).
Figure 9
Figure 9
Potential energy distributions of the conformational ensembles for the the trp-cage (first column, panels A, D), cdp-1 (second column, panels B, E), and fsd-1 (third column, panels C, F) mini-proteins obtained using the the AGBNP1/OPLS-AA (first row, panels A, B, and C; full line) and AGBNP2/OPLS-AA (second row, panels D, E, F; full line) effective potentials and explicit solvation (dashed line). The distributions are shown as a function of the energy gap per residue (Δu) relative to the mean effective potential energy of the implicit solvent ensemble distribution.
Figure 10
Figure 10
Potential of mean force of ion pair formation between propyl-guanidinium and ethyl-acetate in the coplanar orientation with AGBNP implicit solvation (A) and explicit solvation (B; reference 130). In (A) “AGBNP1 (orig.)” refers to the original AGBNP1 parametrization, “AGBNP1” refers to the AGBNP1 model used in this work which includes a surface tension parameter correction for the carboxylate group aimed at reducing the occurrence of ion pairs, “AGBNP2” refers to the current model and “AGBNP2-SEV” the current model without hydrogen bonding and surface tension corrections. The potentials of mean force are plotted with respect to the distance between the atoms of the protein sidechain analogs equivalent to the Cζ of arginine and the Cγ of aspartate.
Figure 11
Figure 11
Diagram illustrating the hydration site locations for each of the functional group geometries used in this work. Linear: hydrogen bond donor; trigonal(1) and trigonal(2): trigonal planar geometries with, respectively, one and two covalent bonds on the acceptor atom; tetrahedral(2) and tetrahedral(3): tetrahedral geometries with, respectively, two and three covalent bonds on the acceptor atom. Representative molecular structures are shown for each geometry.

References

    1. Levy RM, Gallicchio E. Annu Rev Phys Chem. 1998;49:531–67. - PubMed
    1. Feig M, Brooks C. Curr Op Struct Biol. 2004;14:217–224. - PubMed
    1. Roux B, Simonson T. Biophysical Chemistry. 1999;78:1–20. - PubMed
    1. Felts AK, Andrec M, Gallicchio E, Levy R. Water and Biomolecules - Physical Chemistry of Life Phenomena. Springer Science; 2008. Protein Folding and Binding: Effective Potentials, Replica Exchange Simulations, and Network Models.
    1. Gallicchio E, Zhang LY, Levy RM. J Comp Chem. 2002;23:517–529. - PubMed

LinkOut - more resources